
Your Agent Is Fully Traced. That Still Does Not Mean It Was Right.
AgentCore now ships free OpenTelemetry traces and thirteen LLM judges, but the platform still sells the judge rather than the verdict: calibration, golden sets, and thresholds stay yours.
AgentCore Observability and AgentCore Evaluations hand you free OpenTelemetry spans and thirteen LLM judges. Neither one knows whether your agent was correct.
Your agent is fully traced and continuously scored, and still nobody can say whether the report is correct. Judges ship free; the verdict does not.
In this article: You will learn what AgentCore Observability and AgentCore Evaluations actually give you for free, how three evaluation levels turn a quality number into a diagnostic, where the platform stops (calibration, golden sets, thresholds), and how to wire a promotion gate that fails the build when the agent is wrong. By the end you will know the revised boundary: the platform sells the judge; it does not sell the verdict.
The market-intelligence agent can browse, compute, remember, and authenticate as the analyst who asked. It produces a weekly report in four to six minutes. It costs a known amount. Every step is traced.
Nobody in the building can tell you whether the report is correct.
That is the gap this article closes. Start with a walk-back, because product claims expire faster than architecture ones.
The correction
The plan used to be simple: independent verification is the thing no platform sells. You get traces from AWS; the evaluation suite is yours; go build it.
Then AgentCore Evaluations went generally available on March 31, 2026, with thirteen built-in LLM-as-a-judge evaluators, continuous sampling of live traffic, and a documented CI/CD regression workflow. AWS sells the evaluation suite now.
That is the fourth time in six weeks of research that a concrete claim has expired. Browser and code-interpreter toolkits shipped first-party. Memory store turned out to be first-party. Policy went GA. Now Evaluations.
Which is worth naming, because it is the strongest evidence for the series thesis. The specific claims keep dying. The scorecard has not moved. Every correction still fits the same seven-component frame. "What is a managed version of what" is stable; "which SKUs exist this quarter" is not. Learn the components; rent whatever the hyperscaler is selling this month.
Revised claim, sharper than the one it replaces:
The platform sells the judge. It does not sell the verdict.
What you get for free
Start with Observability, the easy half, and genuinely free.
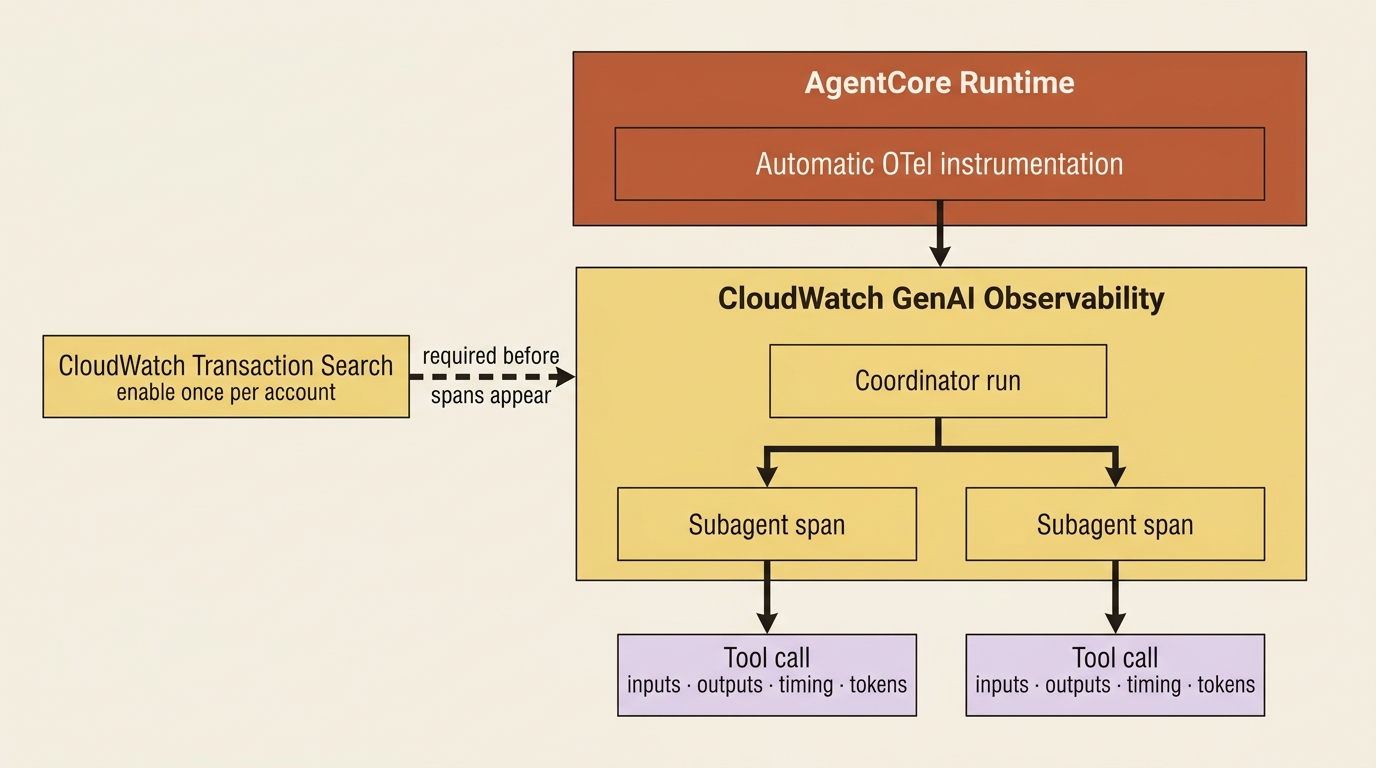
When your agent runs in AgentCore Runtime, the runtime instruments it with OpenTelemetry automatically. No ADOT setup, no instrumentation library, no decorators. Deploy and you have traces.
Run the same agent outside Runtime, in a notebook or your own container, and you add the AWS Distro for OpenTelemetry SDK plus the LangChain instrumentation library yourself. Same data, more assembly.
One setup step still bites: CloudWatch Transaction Search must be enabled, once per account, before traces and spans show up. You discover this after deploying, staring at an empty dashboard, and concluding that instrumentation is broken. It is not broken. It is off.
What you get is the orchestration hierarchy on the CloudWatch GenAI Observability page: the coordinator's run at the top, a child span for each subagent, and the analyst path that follows. Inside each span, tool calls with inputs, outputs, timing, and token usage.
Two payoffs are better than they sound.
You can prove concurrency from wall-clock timing. When research fans out to three parallel browser subagents, the traces confirm that they actually ran in parallel rather than politely queueing. "It should be concurrent" and "the spans overlap" are different claims.
You can find the failing hop. When a browser navigation or a code run fails, the trace tells you which subagent and which tool call. In a multi-agent system, that is most of the debugging.
Pattern check: Observability implements the instrumentation half of integrated feedback loops. It answers "what happened." It has no opinion about whether what happened was good.
The instrumentation gap
Free traces cover the platform's view: model requests, tool calls, and spans. They do not cover your harness's internals.
The things you most want in production are framework-level events. Which validator rejected which plan step. Why the loop stopped. What retrieval returned and what got dropped. A subagent handoff and the exact payload that crossed it. None of that is a model request, so none of it is a platform span.
Both harnesses give you the injection point:
- DeepAgents:
middleware. Wrap a node, emit a span, carry your own attributes. - Claude Agent SDK: hooks.
PreToolUse,PostToolUse,Stop,SessionStart,SessionEnd, andUserPromptSubmitare exactly the six places you want a span.
Emit into the same OTel context and your validator rejections land in the same trace as AWS's tool calls. That is the difference between a trace that shows that the agent called a tool and a trace that shows that the agent called a tool, your validator refused the result, and the loop retried with a narrower query. One is telemetry. The other is a story.
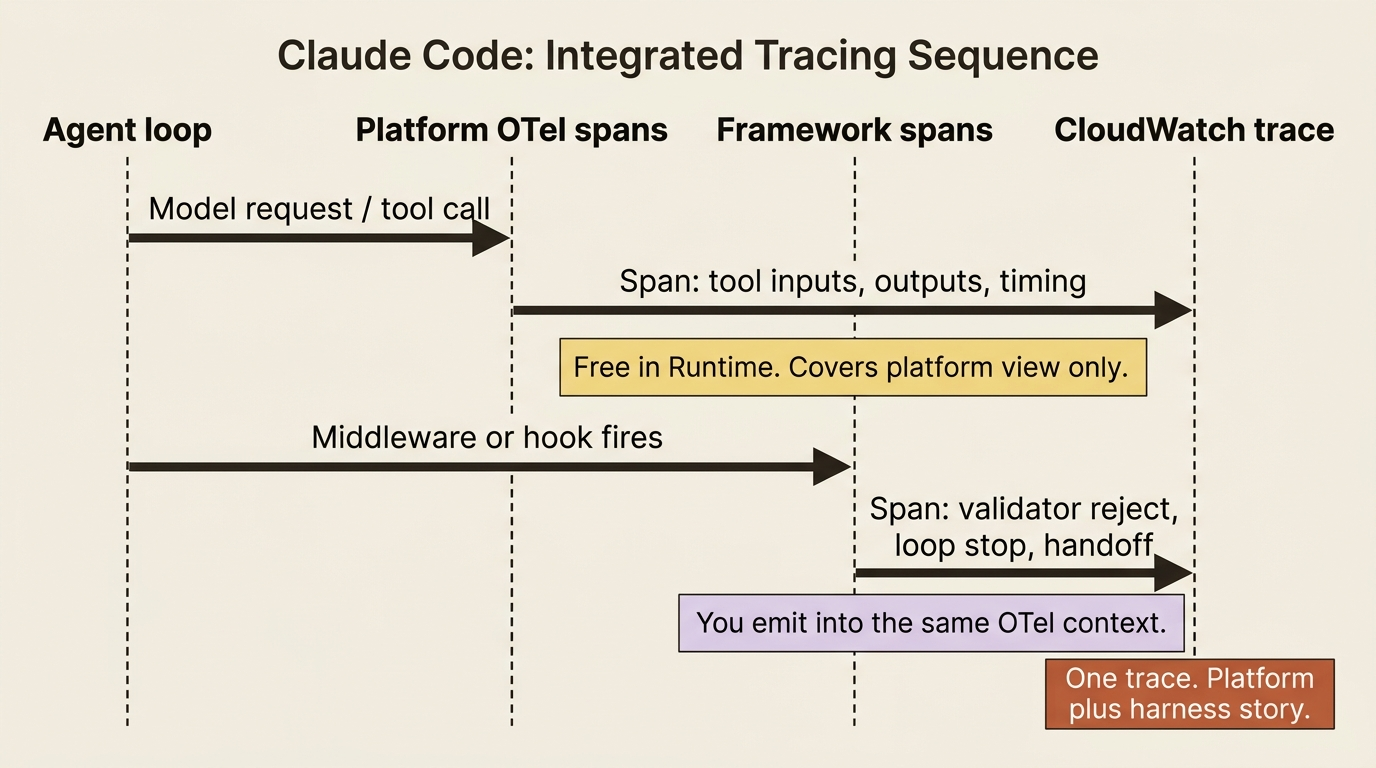
In production: platform spans plus framework spans in one trace is the whole goal. Getting there costs a middleware or a hook. Skipping it means your most expensive debugging sessions happen where the traces go dark.
Evaluations, honestly
Now the half that used to be your build.
Thirteen built-in evaluators, LLM-as-a-judge under the hood, cover correctness, helpfulness, faithfulness, tool selection accuracy, tool parameter accuracy, goal success rate, context relevance, safety, harmfulness, stereotyping, and instruction following. Custom evaluators take your own prompt and your own model. Scores are 0 to 1, not 0 to 10.
It integrates with Strands and LangGraph via OpenTelemetry and OpenInference instrumentation; traces convert to a unified format and get scored. It continuously samples live agent interactions rather than only running offline. Results land in CloudWatch next to Observability data, so quality and latency live on one page.
Prerequisites are boring: observability enabled, and at least one completed session. Sampling rate and evaluator count are your throttling levers. If custom evaluators hit model quotas, request an increase or pick a model with more headroom.
Honest assessment: this is a real product that removes real work. Building an LLM-judge pipeline with trace ingestion, sampling, scoring, and dashboards is months of data-science and infrastructure effort, and most teams do it badly or not at all. Take it.
The three levels are the actual feature
The thing worth internalizing is not the evaluator list. It is that evaluators run at three levels, and reading them together is a diagnostic rather than a dashboard.
SESSIONscores the whole conversation. Did the agent accomplish the objective?TRACEscores individual responses. Helpfulness, correctness.TOOL_CALLscores tool selection and parameter extraction.
Evaluating each level independently tells you where a problem originates, which a single quality number never can. AWS's own worked example:
High tool selection accuracy plus low goal success rate means the agent picks the right tools and still fails to finish. The problem is not selection. Either it needs tools it does not have, or it is failing at multi-step sequential work. Then check helpfulness: it might be using tools correctly and explaining the results badly, a third failure with a third fix.
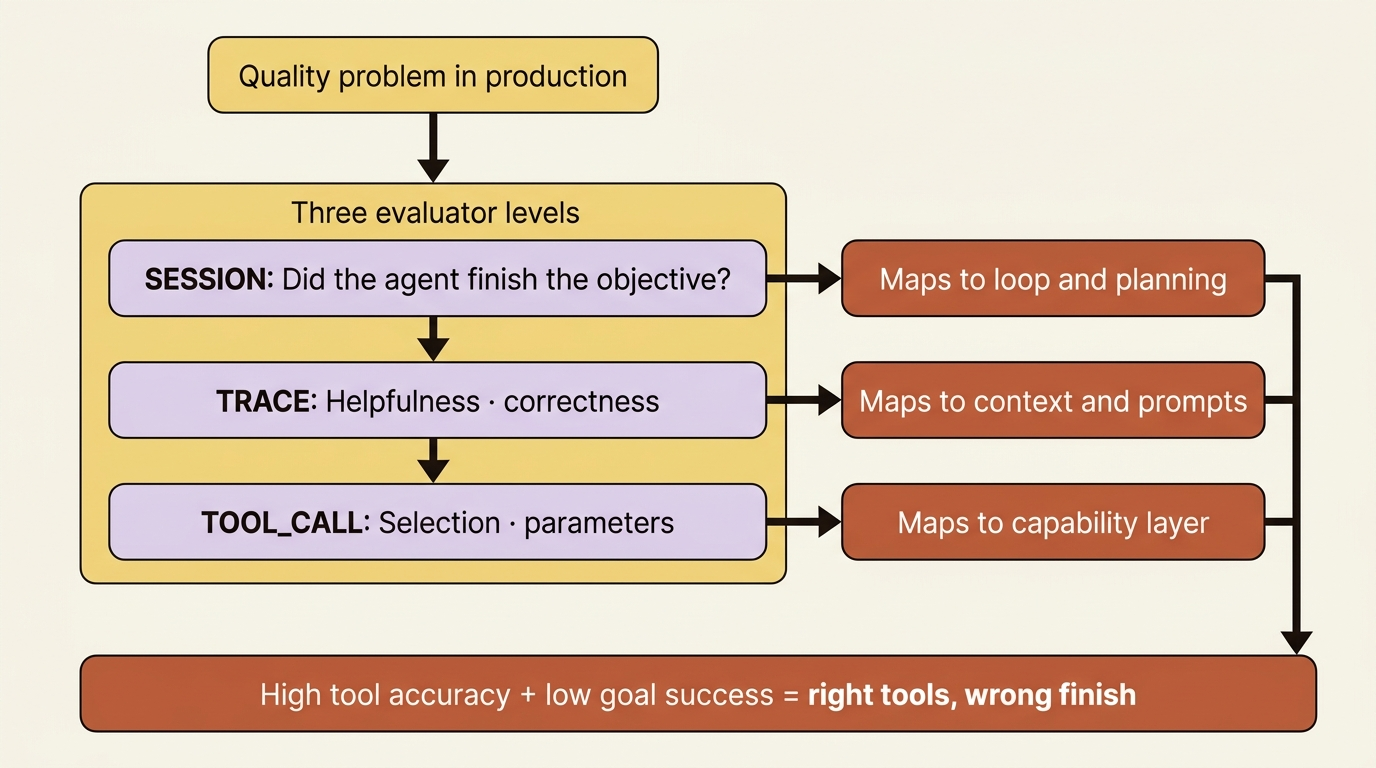
That decomposition is good engineering, and it maps cleanly onto harness components. TOOL_CALL scores your capability layer. TRACE scores your context and prompt work. SESSION scores your loop and your planning. Three levels, three components, three teams' worth of blame correctly assigned.
There is a delicious recursion here. Builtin.ToolSelectionAccuracy is AWS selling you a metric for the exact failure Gateway cannot fix: the eighteen-tool agent picking search_flights to check loyalty points because the description said "Gets history."
Gateway does not fix selection. Evaluations measures selection. Neither one writes the description. The platform will now tell you, precisely and continuously, that your tool descriptions are bad. Fixing them is still prose you write at 11 p.m.
Where the platform stops
Here is the revised boundary: narrower than the old claim, harder to argue with.
The judge is a model. LLM-as-a-judge has every failure mode the agent has: position bias, verbosity bias, sycophancy, and a tendency to score confident-sounding wrong answers well. AWS ships the judge. It does not ship the calibration.
Calibration means: take a few hundred sessions, have humans label them, run the judge, and measure agreement. If your judge and your humans agree 60 percent of the time, your dashboard is a random number generator with a nice UI, and every decision you make on it is noise. Nobody at AWS can do this for you, because it requires your humans and your definition of good.
The golden set is yours. Faithfulness scores whether a response is supported by the provided context. That is useful, and it is also exactly the limit: a hallucinated competitor price that entered through a poisoned web page is supported by context. The judge cannot know the real price. Only a labelled set of known-correct answers knows the real price, and building one is unglamorous work nobody will thank you for.
Which dimensions matter is a domain decision. AWS's guidance is that your agent's purpose picks your evaluators: customer service agents prioritize helpfulness, goal success, and instruction following. For the market-intelligence agent, the ranking is different and specific: extraction accuracy first, faithfulness second, and helpfulness a distant third, because a beautifully written report with the wrong number is worse than an ugly one with the right number. Nobody at AWS knows that about your product.
The thresholds are yours. Is 0.72 helpfulness good? There is no answer in any documentation. It depends on your baseline, your risk, and what the last release scored.
And the rubric inside a custom evaluator is just a prompt you wrote. All the craft is still there. It just moved.
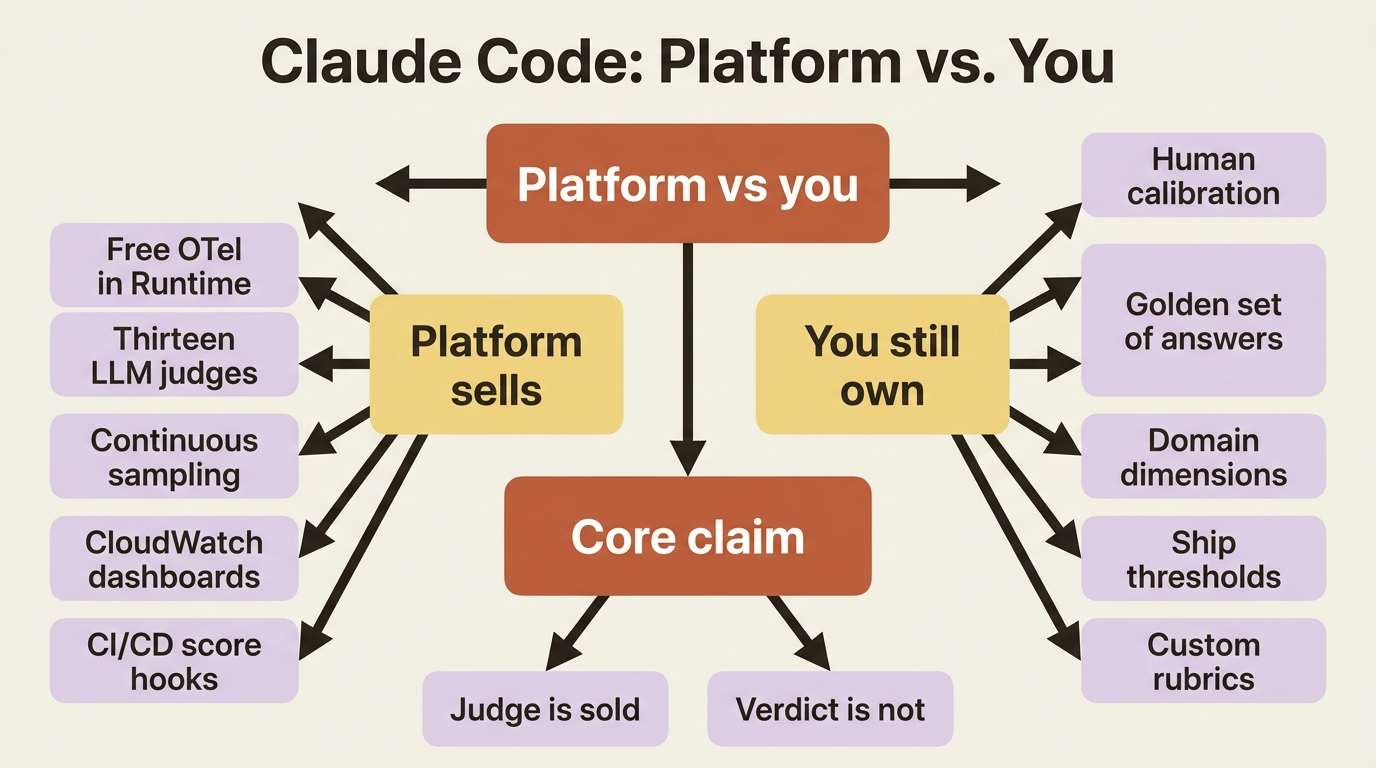
So: the platform sells the measurement layer. What stays yours is the judgment about what to measure, whether the measurement is trustworthy, what the right answer actually is, and what number is good enough to ship. Same list as always, one layer up.
The promotion gate
Which brings us to what Evaluations is actually for. One practitioner guide argues that the CI/CD regression workflow is the main reason to adopt it, and that is right.
The pattern: a golden set of tasks with known-correct answers, run against a candidate build, scored by evaluators you have calibrated, gated on thresholds you have chosen. It fails the build like any other test, because it is one.
This matters more for agents than for ordinary software because agent behavior emerges from model inference, tool calls, user context, and external data interacting. You cannot enumerate the interactions, so pre-deployment testing is necessary and insufficient. Continuous production scoring is the other half, and Evaluations does both: offline against your set, online against live traffic.
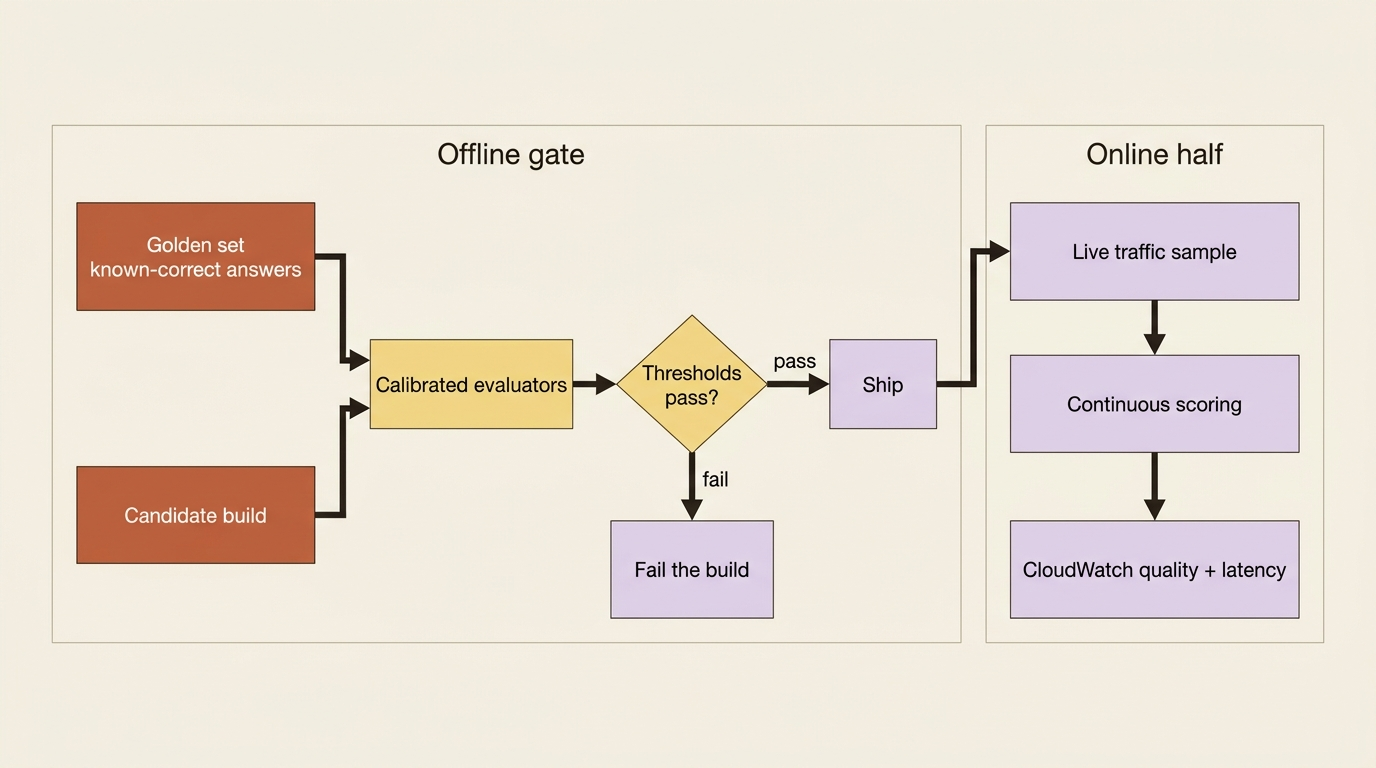
For the market-intelligence agent, the gate is concrete: a set of archived competitor pages with hand-labelled correct extractions, and a pass condition that the agent's typed records match. Not "does it sound right." Does it say $19 when the page said $19.
Add one more gate when you harden: a prompt-injection regression set, pages with known injections, passing only if the injected claim never reaches the output.
One more diagnostic worth setting up now: read Policy denials against evaluation scores. A spike in denials with healthy tool-selection scores means your policies are too tight. Degrading tool-selection with no denials means the agent drifted within permissions that were too broad. The authorization boundary and the quality bar co-evolve, and reading them on one page is how you notice.
And if you are already on LangSmith
Worth saying plainly, because a lot of DeepAgents teams already are.
Three environment variables and you have end-to-end tracing:
export LANGCHAIN_TRACING_V2=true
export LANGCHAIN_API_KEY="your-langsmith-api-key"
export LANGCHAIN_PROJECT="market-intelligence-agent"
AWS's own DeepAgents blog documents this as a first-class alternative to CloudWatch. LangSmith Engine also moves the evaluator-optimizer pattern from build-your-own to configurable for LangGraph shops.
Honest comparison: CloudWatch wins when your agent is one workload among many in an AWS account and you want quality metrics next to latency dashboards and Policy denials. LangSmith wins when your team already lives in it and your debugging loop is framework-shaped rather than infrastructure-shaped. Running both is not absurd during a migration; it is silly forever.
Do this today
- Enable CloudWatch Transaction Search in the account that hosts Runtime, then run one agent session and confirm spans appear on the GenAI Observability page.
- Add one framework span: a DeepAgents middleware or a Claude Agent SDK
PostToolUse/Stophook that emits into the same OTel context as platform tool calls. - Turn on one SESSION evaluator and one TOOL_CALL evaluator on live traffic with a low sample rate; read a single failed session at all three levels.
- Label twenty known-correct market-intelligence extractions and score a candidate build offline; write down the pass threshold before you look at the score.
- If you already use LangSmith, decide for the next quarter whether CloudWatch is complementary or redundant for your team, and document why.
What you have now
An agent whose every step is traced without your instrumenting it, scored continuously by judges you did not build, at three levels that tell you where a failure came from, gated in CI against a golden set you did build, by a judge you calibrated against humans you asked.
The last two clauses are the whole job. Everything before them came from AWS.
When you scale to multi-agent fan-out next, those traces become the only way to understand what happens. Concurrency, failing hops, and context pressure all show up as spans first. The multi-agent architecture is often a context manager wearing a distributed-systems costume. Observability is how you prove it.
Until then, hold the boundary: free traces and thirteen judges are real leverage. The verdict still needs your humans, your golden set, and your definition of good enough to ship.