
The Green Dashboard and the Seven Customers Who Were Never Booked
Server dashboards measure whether the process is alive, not whether the agent is making good decisions, and that gap is where silent failures hide; the fix is to make every harness decision a queryable span and to gate releases on drift.
Your monitoring says the agent is healthy. Your customers say otherwise. AI agent observability is the discipline that closes that gap, and it starts with one span you are almost certainly not recording.
Your dashboard is green while your agent quietly hands seven customers confirmation numbers for flights that were never booked. Your monitoring says the agent is healthy.
In this article: You will learn why server metrics cannot see what an AI agent actually decides, how to instrument agents against the OpenTelemetry GenAI conventions so the backend becomes a configuration choice, how to detect the three operationally distinct kinds of drift, and how to wire a drift signal into a promotion gate that blocks a bad deploy before it reaches users. We build each piece twice: once in the Claude Agent SDK, once in LangChain Deep Agents.
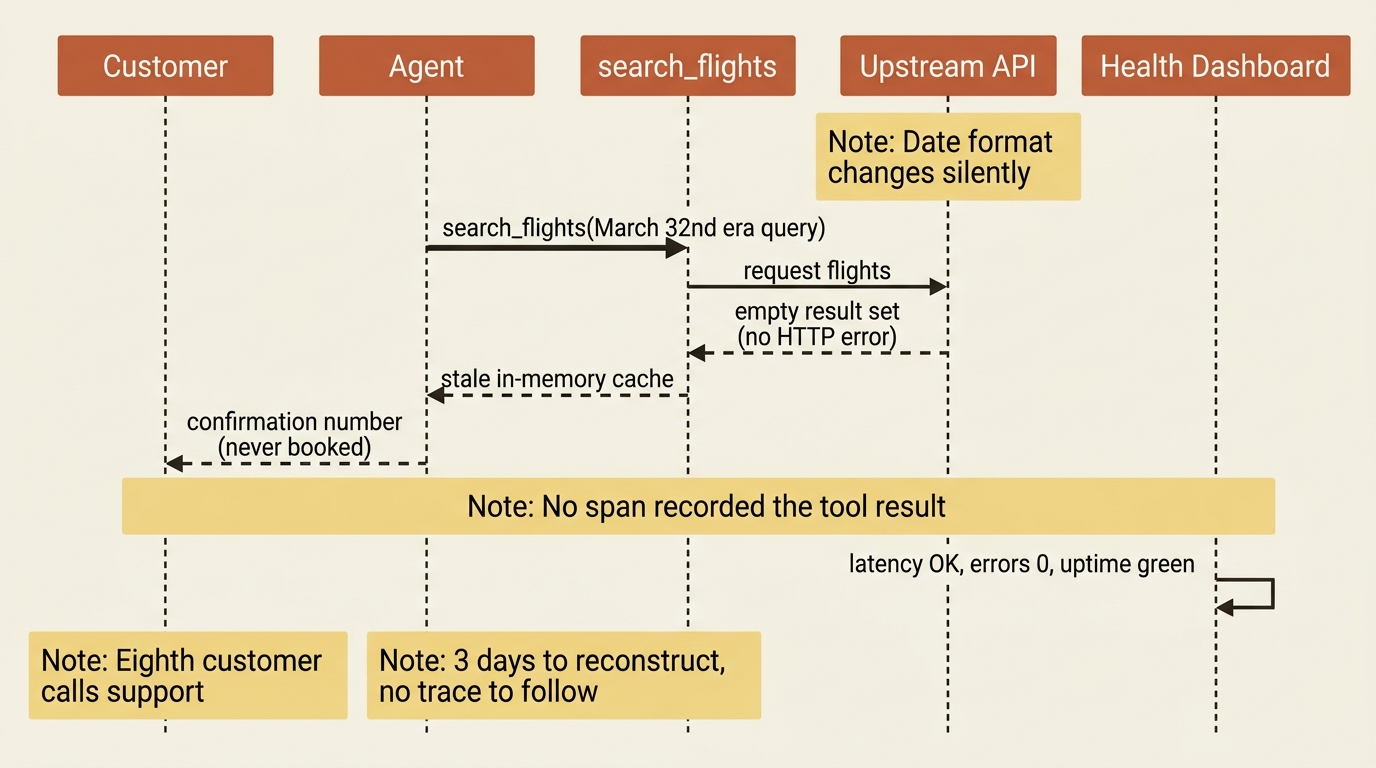
At 3 a.m. on a Tuesday, a rebooking service returned confirmation numbers to seven customers whose flights had not actually booked. An upstream API had silently changed its date format, so search_flights had been returning an empty result set for forty minutes. The agent, with no record of what the tool actually returned, kept pulling from a stale in-memory cache and presenting the results as fresh. No HTTP error fired. The system health dashboard showed green. The first person to notice was the eighth customer, who called support. The incident took three days to reconstruct, because there was no trace: no span saying what search_flights returned, no span saying the model decided to book on stale data, nothing to walk backward from the complaint to the cause.
This is a familiar failure grown up. In a naked agent, a tool returns an error and the model reports success. Here, the same silent error ran for forty minutes across seven customers, and the reason nobody caught it is that the harness recorded nothing about its own decisions. The fix is not a smarter model. It is making every decision the harness makes visible enough to read, query, and alert on.
You are monitoring the server, not the agent
The 3 a.m. dashboard was green because it measured the wrong layer. Latency, error rate, and uptime tell you the process is alive. They cannot tell you what the agent decided, why, what search_flights returned, or where the booking went wrong. Server metrics and agent-level telemetry measure completely different things, and the gap between them is exactly where the seven bookings disappeared.
The unit of agent-level telemetry is the span: a structured record of one decision, with attributes you can query. A travel-booking harness carries seven span kinds, and each one guards a failure mode that becomes invisible without it:
- Model call, without which you have no cost attribution.
- Tool call, carrying the tool name, arguments, and crucially the result. The missing one at 3 a.m.
- Validator, without which a rejection has no audit trail.
- Memory write, without which you cannot trace a corrupted fact.
- Subagent handoff, without which a runaway delegation loop is invisible until the bill arrives.
- Evaluator decision, without which quality drift has no signal.
- Promotion gate, without which a broken release ships.
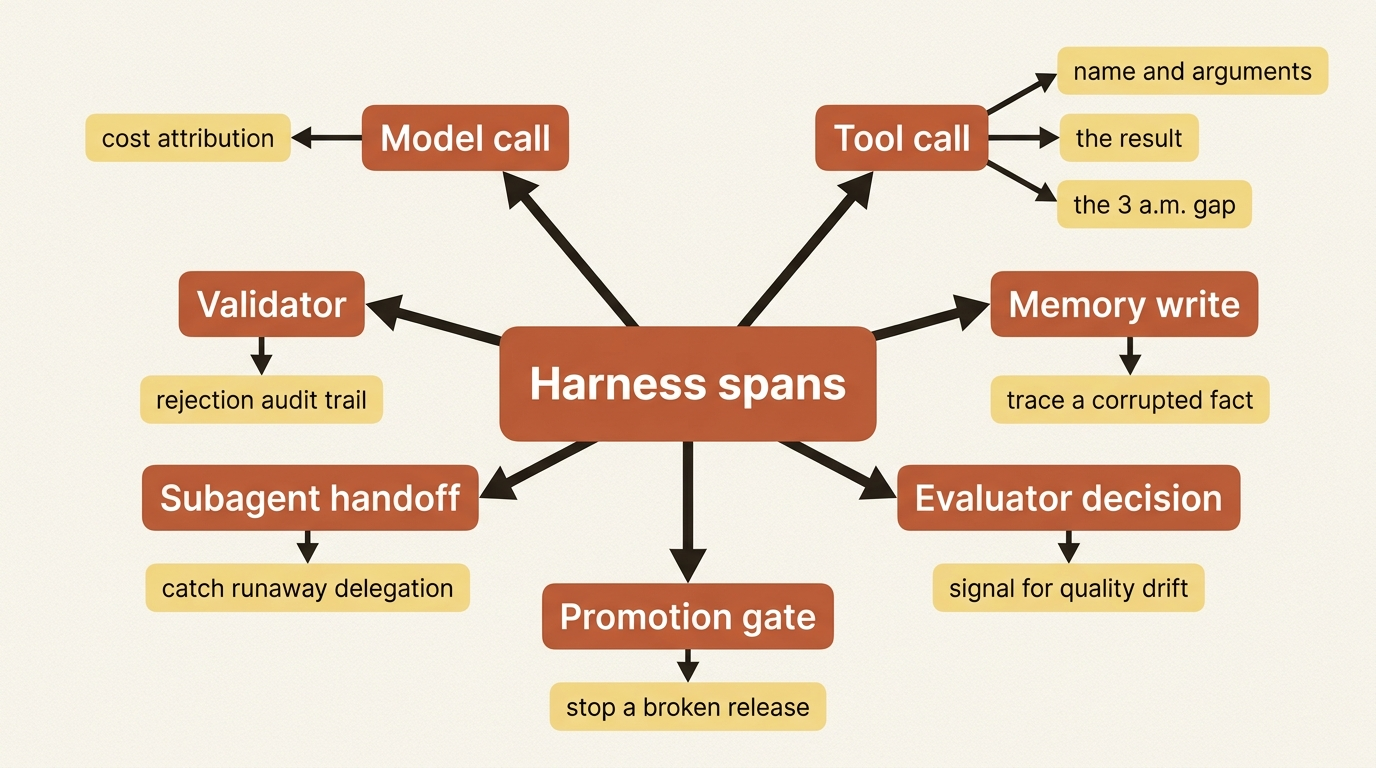
The span that would have ended the incident in one query is the tool-call result span: gen_ai.tool.call.result: {"status": "error", "flights": null} and error.type: DATE_FORMAT_MISMATCH. That is the one to build first.
Instrument once, choose the vendor later
Here is the honest answer to "which observability tool," and it is genuinely framework-spanning: instrument against the OpenTelemetry GenAI semantic conventions, a vendor-neutral vocabulary of gen_ai.* span attributes, and the backend becomes a configuration choice. Langfuse today, LangSmith next quarter, Datadog next year, with no span rewrite. Both frameworks in this series emit telemetry that lands in OTel-compatible backends, so the discipline is the same on either side: name the spans, set the standard attributes, point the exporter wherever you like.
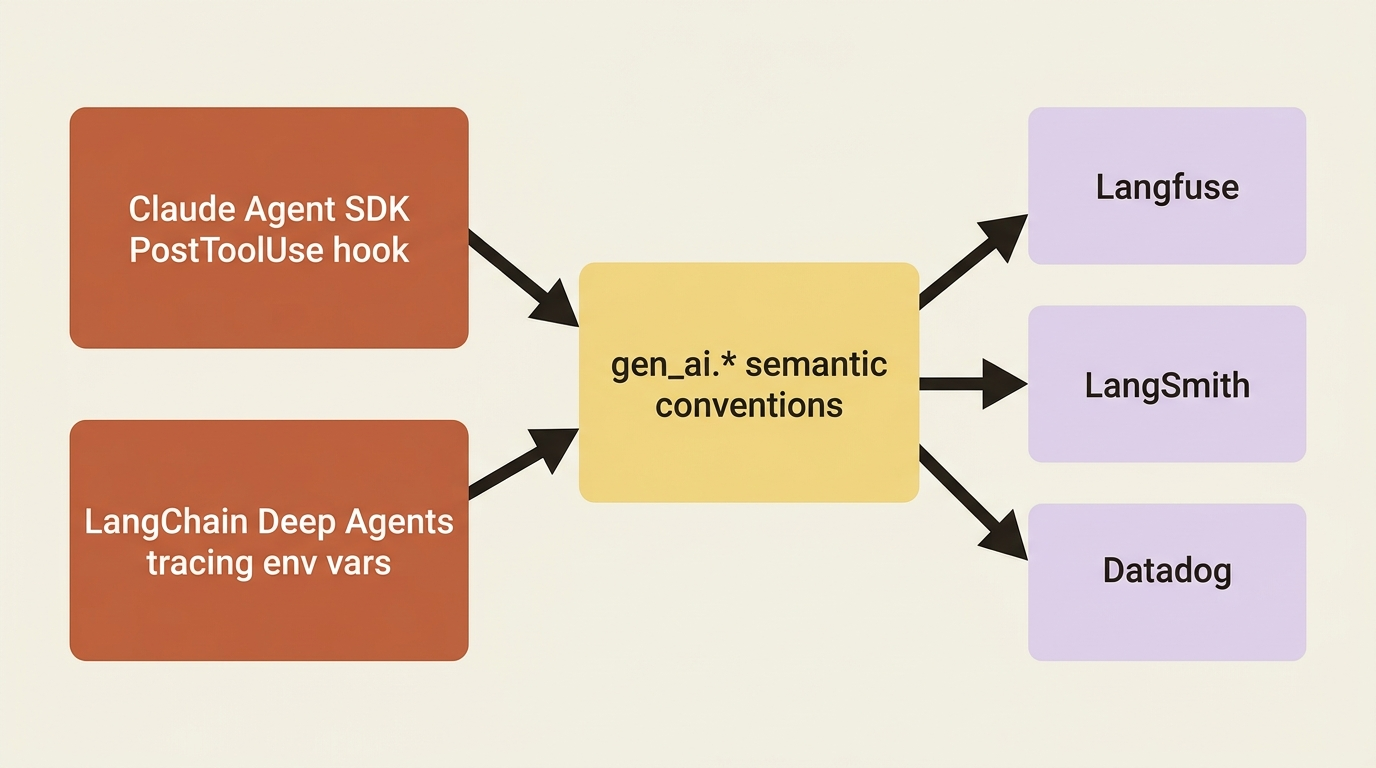
In the Claude Agent SDK, a PostToolUse hook is the natural place to record the tool-call result span, the one whose absence cost three days.
The hook fires after every tool call and opens one span per call, writing the standard gen_ai.* attributes and converting an error result into a filterable signal.
from claude_agent_sdk import ClaudeAgentOptions, HookMatcher
from opentelemetry import trace

tracer = trace.get_tracer("travel_booking_agent")

async def span_tool_result(input_data, tool_use_id, context) -> dict:
    name = input_data.get("tool_name", "")
    with tracer.start_as_current_span(f"execute_tool {name}") as span:
        span.set_attribute("gen_ai.tool.name", name)              # ① queryable tool id
        span.set_attribute("gen_ai.tool.call.id", tool_use_id or "")
        result = input_data.get("tool_response", "")
        span.set_attribute("gen_ai.tool.call.result", str(result)[:2000])  # ② the 3 a.m. gap
        if isinstance(result, dict) and result.get("is_error"):
            span.set_attribute("error.type",
                               result.get("error", "TOOL_ERROR"))  # ③ surfaces silent errors
    return {}

options = ClaudeAgentOptions(
    hooks={"PostToolUse": [HookMatcher(matcher="*", hooks=[span_tool_result])]},  # ④ wire on every tool
)
① The tool name becomes a queryable attribute, which is also what makes behavior-drift
detection possible later.
② Recording the result is the single span that would have caught the empty result set in
minute one instead of minute forty.
③ An error result sets error.type, turning a silent failure into a filterable signal.
④ The PostToolUse matcher "*" attaches the hook to every tool, so no call escapes the
span.
For the model-call span, the SDK's ResultMessage carries total_cost_usd and token usage, so cost attribution falls out of the same instrumentation.
Note: The full extracted listing at code/harness_engineering/part-8-observability/listings/01-span-tool-result-hook.py shows the imports and option wiring together.
Deep Agents, on LangChain, ships tracing you turn on with environment variables. Set them and every model call, tool call (inputs and results), and subagent run is captured as a span, no per-call instrumentation.
import os
from deepagents import create_deep_agent

os.environ["LANGSMITH_TRACING"] = "true"             # ① turn tracing on
os.environ["LANGSMITH_API_KEY"] = "ls-..."           # ② route spans to LangSmith
os.environ["LANGSMITH_PROJECT"] = "travel-booking"

agent = create_deep_agent(
    model="anthropic:claude-sonnet-4-6",             # ③ no per-call instrumentation
    tools=[search_flights, book_flight],
)
agent.invoke({"messages": [{"role": "user", "content": "Rebook AC118."}]})  # ④ fully traced
# The search_flights span carries its result, so an empty-set return is visible
# in the trace the moment it happens, not three days later.
① The tracing flag turns capture on without touching agent code. ② The API key routes every span to the LangSmith backend. ③ The agent is built normally; tracing is ambient, so no span calls live in the agent body. ④ The whole loop is captured on invoke, including the tool result that went unrecorded at 3 a.m.
LangSmith reads and exports the same gen_ai.* shapes, so the trace is portable to another backend if you switch. The instinct is identical across frameworks: capture what the tool returned, not just that it was called.
Note: The full extracted listing at code/harness_engineering/part-8-observability/listings/02-deepagents-tracing.py shows the same env-var-driven setup.
Drift: the gap between your eval set and your users
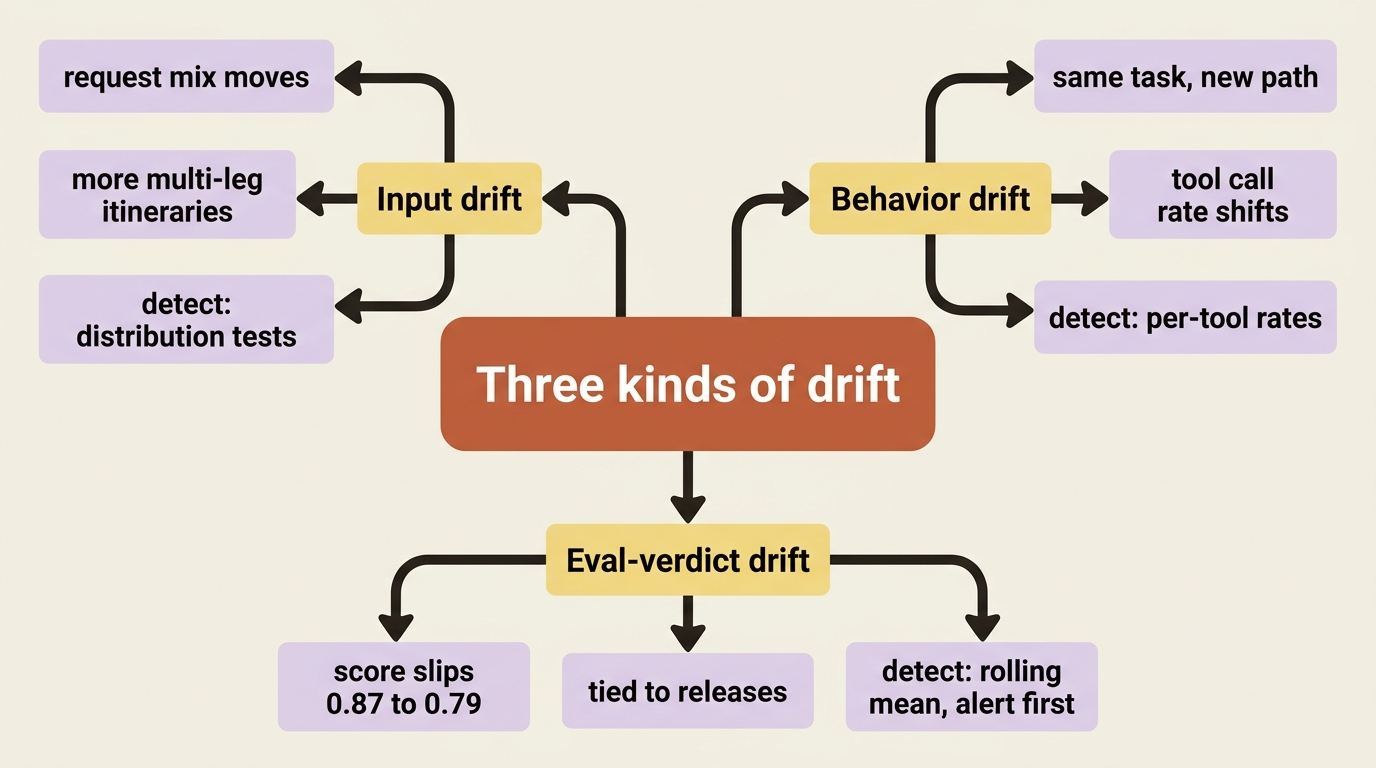
A trace catches an incident in flight. Drift is the slower failure: last Tuesday the eval suite passed green, and today a customer is quoting a route through a city the agent was told to avoid three months ago. Nothing errored. The system simply behaves differently now than when you tuned it, because inputs, the model's serving infrastructure, or upstream tools have shifted underneath it. Span telemetry surfaces three operationally distinct forms:
- Input drift: the distribution of requests moves away from what your eval set covers. More international multi-leg itineraries than last month. Detected with statistical tests on request-category distributions across rolling windows.
- Behavior drift: the agent takes a different path through the same task with no harness
change.
search_flightscalled on 80% of queries in week one, 60% in week three. Detected as a shift in per-tool call rates, which is why the tool-name attribute mattered. - Eval-verdict drift: the rolling mean of an evaluator score slips. Last week's average quality was 0.87; this week it is 0.79, with no code change. This is the form most directly tied to releases, and the one to alert on first.
The detector for eval-verdict drift is small and framework-agnostic: an exponentially weighted moving average over the score, with a threshold on a sustained drop.
class EvalDriftMonitor:
    """Alert when the rolling eval score drops below baseline by a margin."""
    def __init__(self, baseline: float, alpha: float = 0.2, threshold: float = 0.05):
        self.baseline = baseline
        self.ewma = baseline
        self.alpha = alpha                               # ① responsiveness of the average
        self.threshold = threshold

    def observe(self, score: float) -> bool:
        self.ewma = self.alpha * score + (1 - self.alpha) * self.ewma  # ② smooth out noise
        return (self.baseline - self.ewma) > self.threshold            # ③ fire on real drift
① A small alpha rides over single-trace noise and reacts to sustained change.
② Each production eval score updates the moving average, smoothing single-trace noise.
③ The alert fires when the smoothed score has fallen a meaningful margin below baseline,
which happens days before enough customers notice to call.
Feed it gen_ai.evaluation.score.value from your production traces and it watches quality continuously instead of once a week.
Note: The full extracted listing at code/harness_engineering/part-8-observability/listings/03-eval-drift-monitor.py shows the class ready to import.
Observability that stops a bad deploy
Telemetry that only logs is a diary. Telemetry that gates is a control. The last move wires the drift signal into a promotion gate: before a new version ships, it runs against a dataset that includes recent production traffic, and if any drift monitor crosses its threshold, the release fails in CI rather than reaching users.
def promotion_gate(monitor: EvalDriftMonitor, candidate_scores: list[float]) -> bool:
    """Block the release if the candidate triggers eval-verdict drift."""
    drift = any(monitor.observe(s) for s in candidate_scores)
    return not drift                                     # False -> CI fails -> deploy blocked
A gate that runs only against the original golden dataset misses input drift entirely, so the dataset has to keep absorbing hard cases from real traffic.
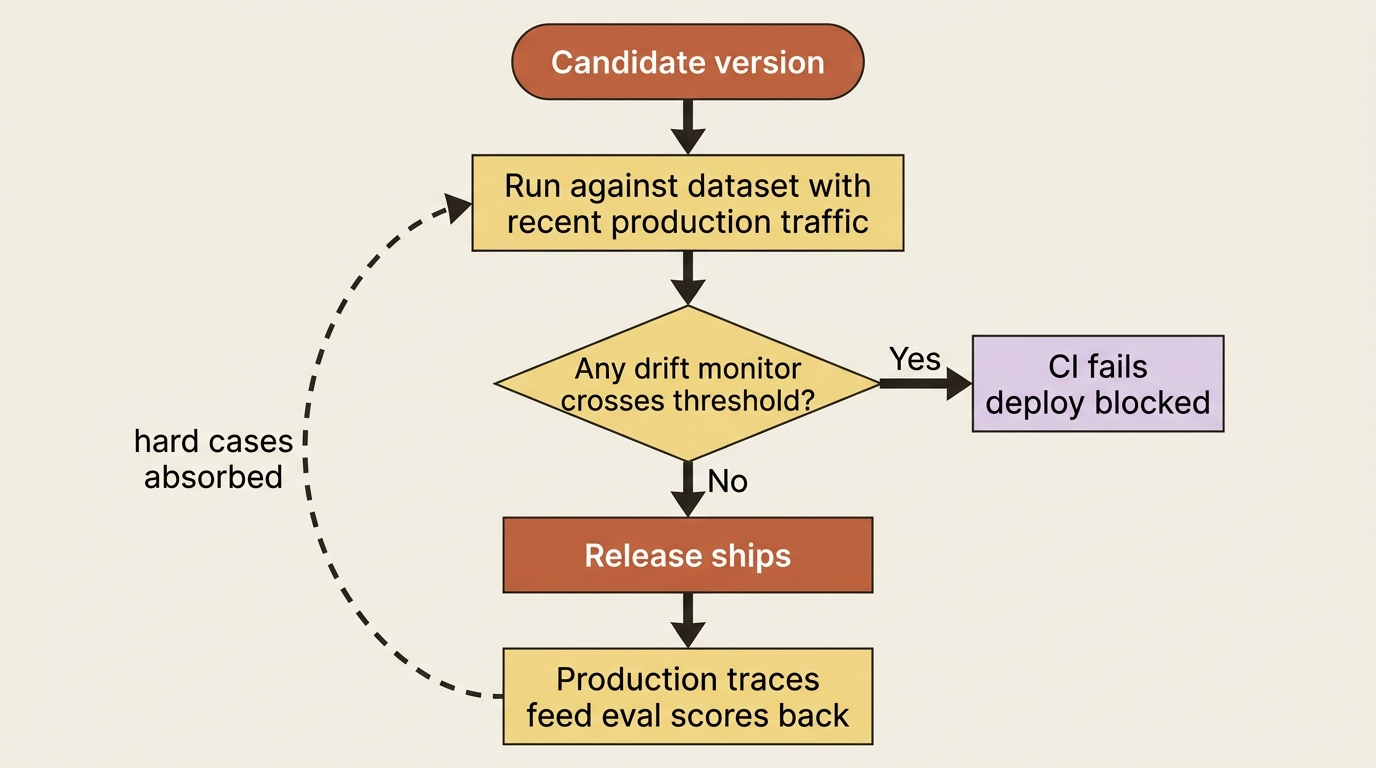
That closes the loop: the harness observes its own behavior, and that observation feeds back as a control that stops the next broken deploy instead of merely recording it. Drift is the gap between what your eval set says and what your users feel. Close it before they tell you.
Do this today
- Wire the
PostToolUsespan and makesearch_flightsreturn an empty error set. Confirm the trace showserror.typewhile a server-level health check stays green. - Feed
EvalDriftMonitora slow four-day slide from 0.87 to 0.79 and confirm the alert fires on the day the smoothed score crosses the threshold, not on the day of the first complaint. - Run
promotion_gateagainst a candidate whose scores trigger drift and confirm it returnsFalse, blocking the deploy. - Pick one tool in your own agent and add a result span today. The cost is a few lines; the payoff is that the next silent failure shows up in a query instead of a support call.
The model was always the easy part
Go back to where an agent project usually starts. A user typed "March 32nd," and a naked agent dispatched it to a destructive call, because the harness had no opinion. Build the harness out and that agent gains opinions everywhere it counts: a contract it cannot violate, a memory it can reason about across turns and sessions, a window it assembles on purpose instead of letting it rot, a recovery path when a step fails mid-flight, an orchestration discipline that splits work only when the split earns its cost, a human gate on the irreversible, and now the telemetry to prove all of it still holds in production, with a gate that stops the next regression before it ships.
None of these are model upgrades. Every one is engineering around the model: the discipline layer that decides what reaches it, what it is allowed to do, what it remembers, and what happens when something goes wrong. That is the whole thesis. Agent equals model plus harness. The model supplies intelligence; the harness supplies reliability, and reliability is what turns a demo into a system people can trust.
You can build each control twice, in the Claude Agent SDK and in LangChain Deep Agents, and watch the same idea survive the framework swap every time. That is the point. The frameworks are tools. The harness is the work, and the work is yours.
The model is the easy part. It has been for a while. Now go build the rest.