Getting Started with Langfuse: Tracing Your First Agent Pipeline
Mastering Langfuse: A Step-by-Step Guide to Implementing Observability in Your Agent Pipelines
Originally published on Medium.
Mastering Langfuse: A Step-by-Step Guide to Implementing Observability in Your Agent Pipelines
Ready to unlock the full potential of your agent pipelines? In just 30 minutes, transform your observability game with Langfuse! Discover how to trace every LLM call and capture invaluable metrics that will elevate your AI systems. Dive into our latest tutorial and start building smarter agents today! #Langfuse #AI #Observability
Summary: Install the Langfuse Python SDK to achieve full trace visibility of LLM calls and tool invocations in under 30 minutes. Use decorators @observe() for custom functions and OpenTelemetry instrumentors for frameworks like Google ADK and LangChain. Set up either a cloud or self-hosted instance, configure environment variables, and implement tracing with minimal code changes. Enrich traces with user and session metadata for better operational insights, all visible in a unified dashboard that supports multiple frameworks.
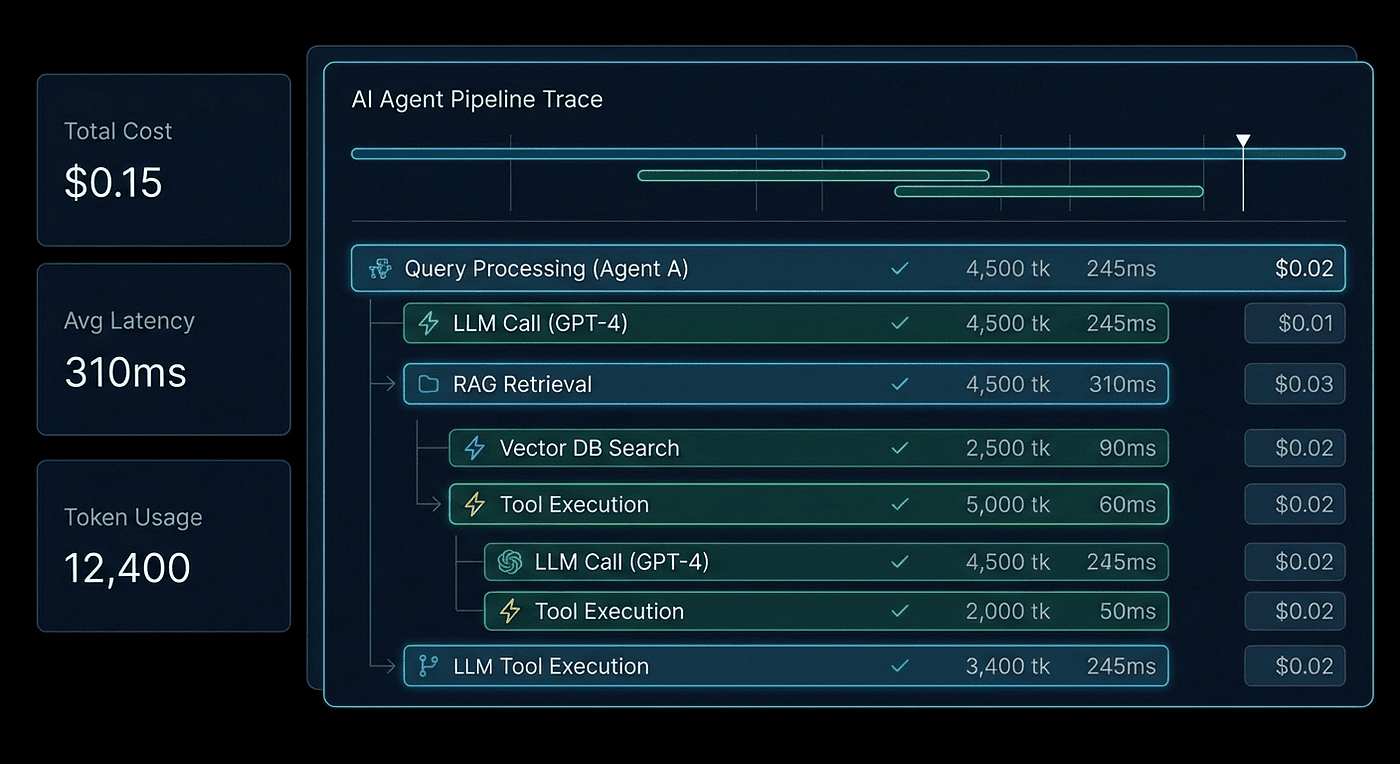
From pip install to full trace visibility in 30 minutes. Every LLM call, tool invocation, and token cost captured.
TL;DR: Install the Langfuse Python SDK, add @observe() decorators to your agent functions, swap your OpenAI import, and get full trace visibility with token costs and latency metrics. This tutorial covers both the decorator approach and OpenTelemetry instrumentors for Google ADK and LangChain. Complete runnable code included.
In the previous article, we established why multi-agent systems need trace-based observability. Logging isn't enough. Print statements are lies of omission. When your agent pipeline makes 47 LLM calls across 12 tool invocations and you're trying to figure out why it hallucinated a customer's billing address, you need traces, not logs.
This article is code. All code. By the end of it, you'll have Langfuse capturing every LLM call, tool invocation, model response, latency metric, and token cost in your agent pipeline. You'll see the entire execution tree in a single dashboard view. Thirty minutes, start to finish.
We'll cover two instrumentation paths: the @observe() decorator for custom Python code, and OpenTelemetry instrumentors for framework integrations like Google ADK and LangChain. Most production systems use both. Let me show you why.
Setup: Cloud vs. Self-Hosted
You have two paths to a running Langfuse instance. Pick one and move on. Don't overthink this.
Cloud: Zero Infrastructure
Sign up at cloud.langfuse.com, create a project, and grab your API keys from the project settings page. That's it. You're done with infrastructure.
The free Hobby tier gives you 50,000 units per month (traces, observations, and scores all count), 30-day data retention, and two team members. That's more than enough to instrument a development pipeline and run experiments. When you outgrow it, paid tiers remove the caps.
My recommendation: start here. Always start here. Move to self-hosted when compliance, data residency, or your security team forces you to. I've seen teams burn two weeks setting up self-hosted infrastructure before writing a single trace. Don't be that team.
Self-Hosted: Docker Compose
For teams where data can't leave your network:
git clone <https://github.com/langfuse/langfuse.git>
cd langfuse
cp .env.example .env
# Edit .env with your PostgreSQL, ClickHouse, and Redis config
docker compose up -d
Access the UI at http://localhost:3000. Self-hosted has no usage limits and runs under the MIT license. The tradeoff is that you own the infrastructure: PostgreSQL for relational data, ClickHouse for analytics, and Redis for caching. Three databases. Keep that in mind when your ops team asks about maintenance windows.
The Three Environment Variables
Regardless of which path you chose, your application needs three environment variables:
export LANGFUSE_PUBLIC_KEY="pk-lf-..."
export LANGFUSE_SECRET_KEY="sk-lf-..."
export LANGFUSE_HOST="<https://cloud.langfuse.com>"  # or your self-hosted URL
Set these once. Every Langfuse SDK call reads them automatically. No config objects, no initialization boilerplate. This is how SDK configuration should work.
For additional production context, you can also set:
export LANGFUSE_TRACING_ENVIRONMENT="production"  # or "staging", "development"
export LANGFUSE_TRACING_RELEASE="v2.1.0"          # your app version
These show up as filterable attributes in the dashboard. Trust me, you'll want these when you're running three environments and trying to figure out which one is burning through tokens.
The @observe() Decorator: Your First Trace
Install the SDK:
pip install langfuse openai
Here's a complete, runnable agent pipeline. Three steps: research a topic, analyze the research, and summarize the analysis. Every function is decorated with @observe(), and we're using Langfuse's OpenAI drop-in replacement to auto-capture every LLM generation. Copy this. Run it. Then we'll look at what shows up in the dashboard.
import os
from langfuse import observe, get_client, propagate_attributes
from langfuse.openai import OpenAI

# Langfuse reads LANGFUSE_PUBLIC_KEY, LANGFUSE_SECRET_KEY, LANGFUSE_HOST
# from environment variables automatically

client = OpenAI()  # Drop-in replacement: auto-traces every LLM call

@observe()
def research(topic: str) -> str:
    """Step 1: Research the topic."""
    response = client.chat.completions.create(
        model="gpt-4o",
        messages=[
            {"role": "system", "content": "You are a research analyst. "
             "Provide detailed research on the given topic."},
            {"role": "user", "content": f"Research the following topic "
             f"thoroughly: {topic}"}
        ],
        temperature=0.3
    )
    return response.choices[0].message.content

@observe()
def analyze(research_output: str) -> str:
    """Step 2: Analyze the research findings."""
    response = client.chat.completions.create(
        model="gpt-5.3",
        messages=[
            {"role": "system", "content": "You are a strategic analyst. "
             "Identify key patterns, risks, and opportunities."},
            {"role": "user", "content": f"Analyze these research "
             f"findings:\n\n{research_output}"}
        ],
        temperature=0.2
    )
    return response.choices[0].message.content

@observe()
def summarize(analysis: str) -> str:
    """Step 3: Create an executive summary."""
    response = client.chat.completions.create(
        model="gpt-5.3",
        messages=[
            {"role": "system", "content": "You are a technical writer. "
             "Create a concise executive summary."},
            {"role": "user", "content": f"Summarize this analysis into "
             f"3-5 key points:\n\n{analysis}"}
        ],
        temperature=0.1
    )
    return response.choices[0].message.content

@observe()
def agent_pipeline(topic: str) -> str:
    """Main pipeline: research -> analyze -> summarize."""
    r = research(topic)
    a = analyze(r)
    return summarize(a)
Run this, then open your Langfuse dashboard. You'll see a trace named agent_pipeline with three child spans: research, analyze, and summarize. Each span contains a generation with the exact prompt, completion, token counts, cost, and latency.
That's it. Your first trace. Two import changes, a few decorators, and you went from zero visibility to complete observability.
What Just Happened Under the Hood
Let's break down the two mechanisms working together here.
The @observe() decorator wraps each function call in an OpenTelemetry span. When agent_pipeline calls research, the decorator creates a child span nested under the parent. The trace tree builds itself automatically from your call hierarchy. You don't manage parent-child relationships. You don't pass trace IDs around. The decorator handles context propagation for you.
The OpenAI import from langfuse.openai is a drop-in replacement for the standard OpenAI client. Swap the import, change nothing else. It intercepts every chat.completions.create call and records it as a generation observation with:
- The complete prompt (system + user messages)
- The full completion text
- Token counts: input, output, and total
- Cost (calculated automatically from the model's pricing)
- Latency (wall-clock time for the API call)
- Model name and parameters (temperature, max_tokens, etc.)
Two import lines changed. Everything else is standard Python and standard OpenAI SDK usage. If your existing code works with the OpenAI SDK, it works with Langfuse's drop-in replacement. I've migrated production services by changing exactly two lines in the import block.
Adding Context with propagate_attributes()
In production, you need more than just traces. You need to know which user triggered the pipeline, which session it belongs to, and what environment it's running in. The propagate_attributes() context manager in SDK v4 handles all of this:
from langfuse import observe, get_client, propagate_attributes

@observe()
def agent_pipeline(topic: str, user_id: str, session_id: str) -> str:
    """Main pipeline with production metadata."""
    with propagate_attributes(
        user_id=user_id,
        session_id=session_id,
        tags=["production", "v2.1", "research-agent"],
        metadata={
            "source": "api",
            "priority": "high",
            "customer_tier": "enterprise"
        },
        version="2.1.0"
    ):
        r = research(topic)
        a = analyze(r)
        return summarize(a)

# Every child span inherits user_id, session_id, tags, and metadata
result = agent_pipeline(
    topic="AI agent frameworks 2026",
    user_id="user_8472",
    session_id="session_abc123"
)
The key insight: propagate_attributes() applies these attributes to the current span and every child span created within its scope. This is the v4 observation-centric data model at work. Rather than attributes living only on the trace (as in v2/v3), they propagate to every observation. The practical benefit is single-table queries in the dashboard, with no expensive joins.
In the dashboard, you can now filter traces by user, session, tag, or any metadata field. "Show me all traces from enterprise customers where cost exceeded $0.10" becomes a one-click filter. That's not a toy feature. That's how you track down the agent pipeline that's costing you $47/day because one user figured out how to trigger a loop.
The OTEL Instrumentor Approach
The @observe() decorator works well for code you write. But if you're using an agent framework like Google ADK or LangChain, those frameworks create their own internal call structures that decorators can't reach. That's where OpenTelemetry instrumentors come in.
Choosing Your Instrumentation Path
The decision tree is straightforward:
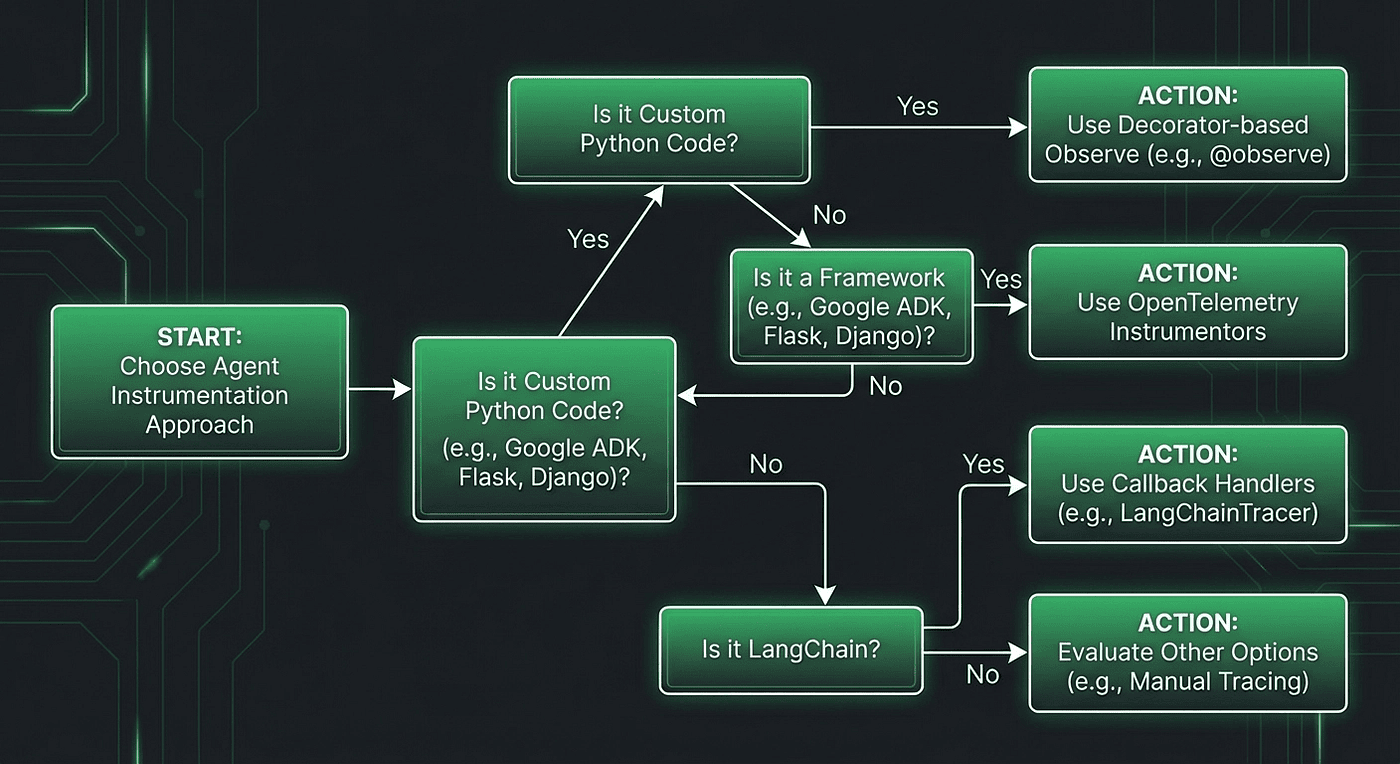
Figure 1: Choosing between @observe(), OTEL instrumentors, or both. Most production systems end up using both.
Three scenarios push you toward the OTEL path:
- Framework auto-instrumentation: You want to capture internal framework spans (think tool dispatch, routing, memory retrieval) without manually decorating framework code you didn't write.
- Existing OTEL infrastructure: Your organization already runs Jaeger, Grafana Tempo, or another OTEL backend, and you want Langfuse as an additional destination for LLM-specific analytics.
- Multi-destination tracing: You need traces flowing to both Langfuse and your existing APM tool. OTEL makes this a configuration change, not a code change.
Google ADK: Five Lines of Instrumentation
If you built the multi-tool agent from Part 1 of my Google ADK Practitioner's Guide series, here's how to add Langfuse observability. The GoogleADKInstrumentor from OpenInference auto-captures every agent step, tool call, and LLM generation. You don't touch your agent code at all.
pip install openinference-instrumentation-google-adk \
    opentelemetry-sdk opentelemetry-exporter-otlp
import base64
import os
from openinference.instrumentation.google_adk import GoogleADKInstrumentor
from opentelemetry import trace
from opentelemetry.sdk.trace import TracerProvider
from opentelemetry.sdk.trace.export import BatchSpanProcessor
from opentelemetry.exporter.otlp.proto.http.trace_exporter import (
    OTLPSpanExporter
)

# Configure OTLP exporter pointing to Langfuse
public_key = os.environ["LANGFUSE_PUBLIC_KEY"]
secret_key = os.environ["LANGFUSE_SECRET_KEY"]
credentials = base64.b64encode(
    f"{public_key}:{secret_key}".encode()
).decode()

exporter = OTLPSpanExporter(
    endpoint=(
        f"{os.environ['LANGFUSE_HOST']}"
        f"/api/public/otel/v1/traces"
    ),
    headers={
        "Authorization": f"Basic {credentials}",
        "x-langfuse-ingestion-version": "4"
    }
)

# Set up the tracer provider
provider = TracerProvider()
provider.add_span_processor(BatchSpanProcessor(exporter))
trace.set_tracer_provider(provider)

# Instrument Google ADK -- this is the only ADK-specific line
GoogleADKInstrumentor().instrument()

# Now run your ADK agent as normal -- all traces go to Langfuse
The x-langfuse-ingestion-version: 4 header enables Fast Preview, which means your traces show up in the dashboard in near-real-time rather than waiting for batch processing. A small detail, but one you'll appreciate when you're debugging a live issue.
Every ADK agent step, tool invocation, and LLM call is now captured and exported to Langfuse via OpenTelemetry. The dashboard shows the same trace tree structure you saw with @observe(), but now it includes the internal framework operations that the decorator approach can't see.
LangChain and LangGraph: The Callback Handler
For LangChain and LangGraph pipelines, Langfuse provides a callback handler that plugs into the framework's existing callback system. This is the simplest integration path of the three:
from langfuse.callback import CallbackHandler
from langchain_openai import ChatOpenAI

# Initialize the Langfuse callback handler
langfuse_handler = CallbackHandler()

# Attach to your LLM
llm = ChatOpenAI(model="gpt-5.3", temperature=0)

# Option 1: Pass callbacks at invocation time
response = llm.invoke(
    "Explain agent observability",
    config={"callbacks": [langfuse_handler]}
)

# Option 2: For LangGraph, attach to the compiled graph
from langgraph.graph import StateGraph

app = graph.compile()
result = app.invoke(
    {"messages": [("user", "Research AI agents")]},
    config={"callbacks": [langfuse_handler]}
)
The callback handler converts LangChain's internal events into Langfuse observations, automatically tracking token usage and cost. One handler. Pass it everywhere.
Using Both Together
Most production systems I've built combine both approaches. OTEL instrumentors handle the framework's internal spans, while @observe() decorators capture your custom business logic. They share the same OpenTelemetry context, so the trace tree seamlessly merges framework spans and custom spans into a single, coherent view.
from langfuse import observe, propagate_attributes
from openinference.instrumentation.google_adk import GoogleADKInstrumentor

# OTEL instruments the framework
GoogleADKInstrumentor().instrument()

# @observe() instruments your business logic
@observe()
def my_business_logic(input_data: str) -> str:
    """Custom logic that wraps framework calls."""
    with propagate_attributes(
        tags=["hybrid-instrumentation"],
        metadata={"approach": "otel+decorator"}
    ):
        # Framework calls auto-instrumented by OTEL
        result = run_adk_agent(input_data)
        # Your custom processing captured by @observe()
        return post_process(result)
The trace tree shows both your custom spans and the framework's internal spans, nested correctly under a single root. No gaps. No orphan spans. One coherent execution story.
Reading a Trace: The Dashboard Walkthrough
You've instrumented your code. Traces are flowing. Now let's actually read them. This is the payoff.
The Traces List
Open your Langfuse project and navigate to the Traces tab. You'll see a list of every trace, showing:
- Name: The root function name (e.g.,
agent_pipeline) - Duration: Total wall-clock time from start to finish
- Cost: Summed cost across all LLM generations in the trace
- Status: Success or error
- User: The
user_idif you set one - Tags: Filterable labels you attached
Click any trace to drill down.
The Trace Detail View
This is where observability earns its keep. The trace detail view shows the observation tree: a hierarchical view of every operation that happened during execution.
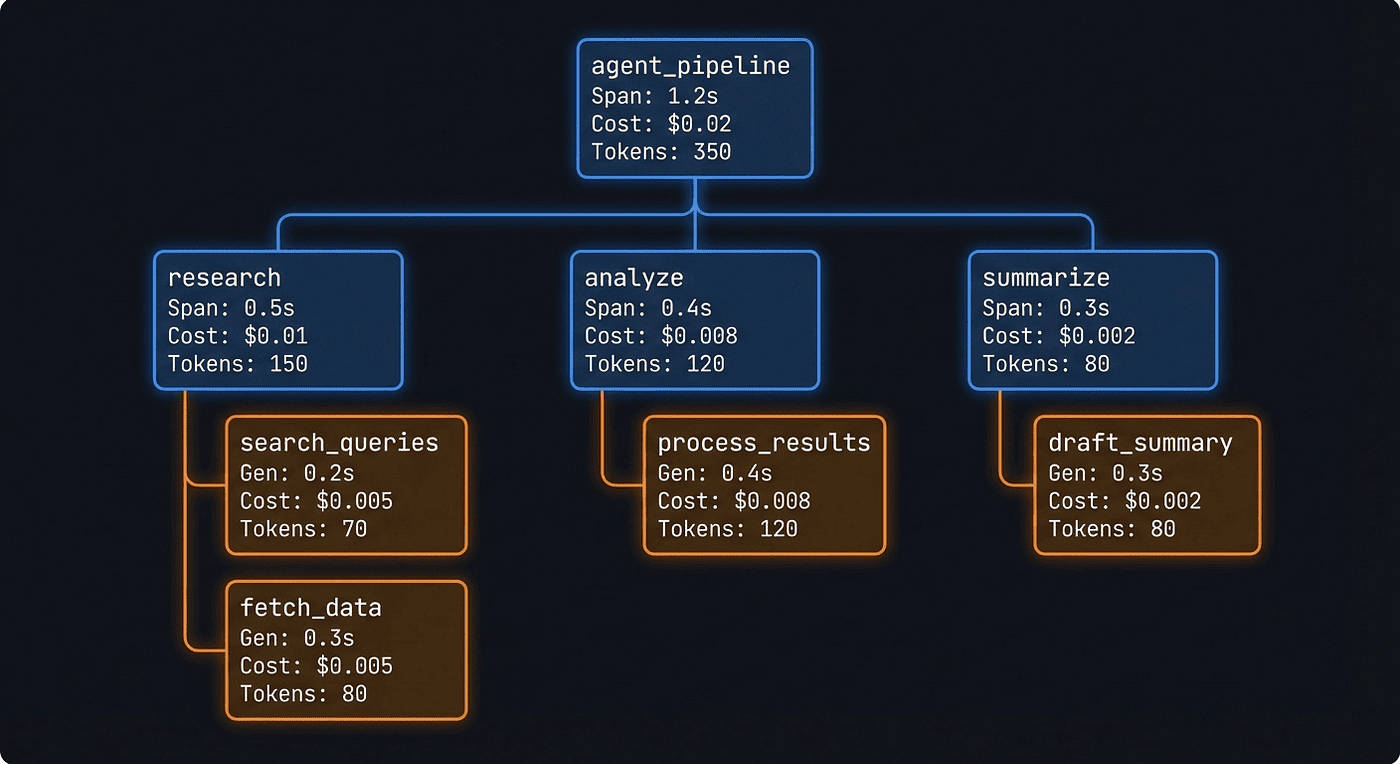
Figure 2: The trace tree for our research pipeline. Each span contains nested generations with token counts, cost, and latency.
For our research pipeline, the trace tree looks like this:
agent_pipeline (12.3s, $0.0153)
 |
 +-- research (4.2s, $0.0043)
 |    +-- [generation] gpt-4o (3.8s, 42 in / 387 out tokens)
 |
 +-- analyze (5.1s, $0.0078)
 |    +-- [generation] gpt-4o (4.7s, 412 in / 623 out tokens)
 |
 +-- summarize (3.0s, $0.0032)
      +-- [generation] gpt-4o (2.6s, 648 in / 215 out tokens)
Every node is clickable. Click a generation to see the exact prompt text sent to the model, the exact completion returned, token counts broken down by input and output, the cost calculated from the model's per-token pricing, and the latency.
The Timeline View
Switch to the timeline tab and you get a waterfall chart showing when each operation started and how long it ran. This is where you discover that your "parallel" tool calls are actually running sequentially because someone forgot to use asyncio.gather(). Or that one tool call is taking 8 seconds while everything else finishes in under 2.
The timeline view is the fastest way to find latency bottlenecks. I've used it to identify cases where an agent was making redundant LLM calls that added 15 seconds to every pipeline run. One look at the waterfall, and the problem was obvious. Fixing it took 10 minutes. Finding it without the timeline would have taken hours.
Generation Details: The Gold
Click any generation node and you see the complete picture:
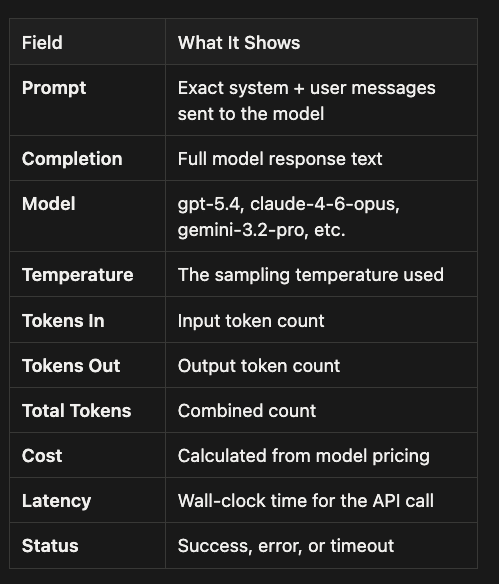
Prompt: The exact input you sent to the model for this generation.
- Includes the full system message(s) and user message(s), plus any developer instructions if your stack uses them.
- This is the primary artifact for debugging when outputs look wrong, because it shows the instructions and context the model actually saw.
Completion: The raw text (or structured output) returned by the model.
- Useful for spotting truncation, refusal messages, formatting drift, or unexpected tone changes.
- In tool-using models, this may include tool-call JSON or function arguments depending on your client.
Model: The specific model identifier used for the call.
- Important because behavior, context window size, and pricing vary by model and version.
- Helps you compare performance and cost across experiments and rollouts.
Temperature: The sampling randomness used for the generation.
- Lower values tend to produce more deterministic, repeatable outputs.
- Higher values tend to increase variety, but can also increase off-target responses.
Tokens In: The number of input tokens consumed by the prompt.
- Typically includes system instructions, user messages, retrieved context, and any serialized tool schemas.
- Key for controlling cost and latency, and for diagnosing "context stuffing" issues.
Tokens Out: The number of output tokens produced in the completion.
- Useful for identifying verbose responses, runaway generation, or responses being cut short by limits.
- Often correlates with latency and cost.
Total Tokens: The combined token usage (input + output) for the call.
- The quickest single metric for cost and throughput impact per generation.
- Good for dashboards and alerting thresholds.
Cost: The estimated monetary cost of the call.
- Computed from token counts and the model's pricing, usually with separate rates for input and output tokens.
- Use this to find expensive steps in a trace and to compare prompt variants objectively.
Latency: How long the model call took end-to-end.
- Usually measured as wall-clock time, and may include network time plus provider processing time.
- Helps you spot slow models, rate limiting, retries, or downstream bottlenecks.
Status: The outcome of the generation.
- Typically indicates success versus error states like timeout, rate limit, provider error, validation failure, or cancellation.
- Critical for reliability tracking and for correlating failures with certain prompts, tools, or models.
This is the data that turns "the agent gave a bad answer" into "the analyze step received a 4,000-token research output but only generated a 50-token analysis because the system prompt was too vague." Specific. Actionable. Debuggable.
What to Look for First
When I open a trace for the first time, I check three things in this order:
- Token usage outliers: One generation consuming 10x more tokens than the others usually means a prompt needs trimming or a context window is being stuffed with unnecessary history. I've seen agents that shoved the entire conversation history into every tool call. Langfuse made it obvious because one generation was 8,000 tokens while the rest were under 500.
- Unexpectedly long operations: A tool call taking 8 seconds when similar calls take 500ms could be a network issue, a cold start, or an upstream API problem. The timeline view makes these stick out immediately.
- Retry patterns: The same input appearing in multiple consecutive generations means your error handling is silently retrying without telling you. That's money burning. I found a production agent that was retrying failed API calls 5 times with no backoff, costing us $12/day in wasted tokens.
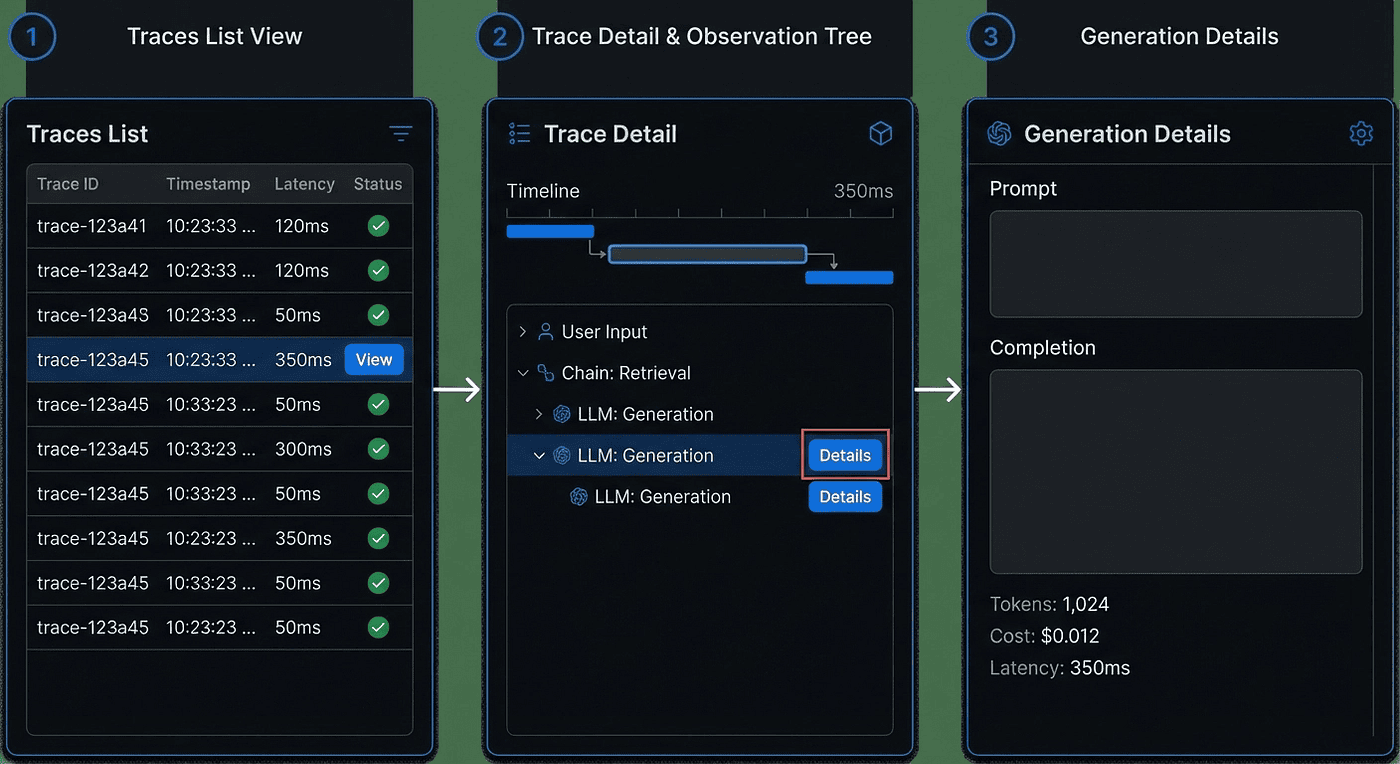
Figure 3: The drill-down flow from trace list to generation details. Each level reveals more specific debugging information.
Enriching Traces for Production
The basic instrumentation captures what happened. Production enrichment tells you who, when, and why. Here's the full pattern I use.
The Four Attributes That Matter
user_id lets you answer: "Which user is burning through our token budget?" Attach it to every trace. When you discover one user is responsible for 40% of your costs, you'll be glad you did.
session_id groups multi-turn conversations. A user asking follow-up questions generates multiple traces. Sessions let you see the full conversation thread and calculate per-conversation costs.
tags are your filtering mechanism. Production vs. staging. Agent version. Experiment name. When something breaks in production, tags let you narrow down the blast radius in seconds:
with propagate_attributes(
    tags=["production", "v2.1", "research-agent", "experiment-42"]
):
    # ... agent logic
metadata is a free-form dict for business context:
with propagate_attributes(
    metadata={
        "source": "api",            # vs. "ui" or "batch"
        "priority": "high",
        "customer_tier": "enterprise",
        "request_id": "req_abc123"
    }
):
    # ... agent logic
All of these are searchable in the dashboard. "Show me all high-priority traces from enterprise customers that failed" is a query you'll run more often than you think.
Complete Production Example
Here's the full pattern, pulling everything together:
import uuid
from langfuse import observe, get_client, propagate_attributes
from langfuse.openai import OpenAI

client = OpenAI()

@observe()
def production_agent_pipeline(
    topic: str,
    user_id: str,
    session_id: str,
    source: str = "api"
) -> dict:
    """Production-grade pipeline with full metadata."""
    request_id = str(uuid.uuid4())

    with propagate_attributes(
        user_id=user_id,
        session_id=session_id,
        tags=[
            "production",
            "v2.1",
            "research-agent",
            f"source-{source}"
        ],
        metadata={
            "request_id": request_id,
            "source": source,
            "customer_tier": lookup_customer_tier(user_id),
        },
        version="2.1.0"
    ):
        r = research(topic)
        a = analyze(r)
        s = summarize(a)

        # Update the observation with structured output
        langfuse = get_client()
        langfuse.update_current_observation(
            output={
                "summary": s,
                "research_tokens": len(r.split()),
                "analysis_tokens": len(a.split()),
            }
        )

        return {
            "summary": s,
            "request_id": request_id,
        }
This gives you user-level cost attribution, session threading, environment filtering, and structured output tracking. When a customer reports a bad result, you have everything you need to reproduce and debug it.
Multi-Framework, One Dashboard
Here's the payoff for using Langfuse as your observability layer: it's framework-agnostic. Every trace from every framework lands in the same project, the same dashboard, the same analytics.
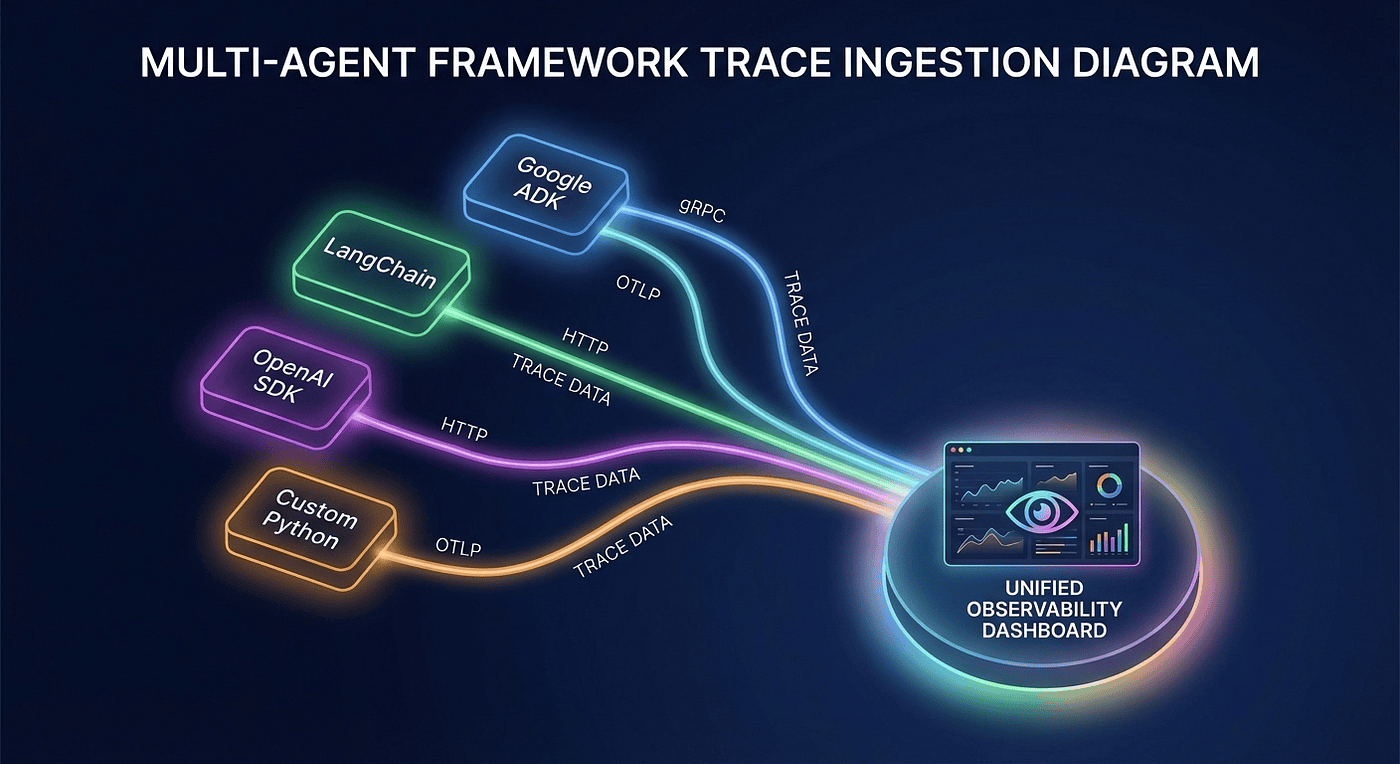
Figure 4: Multiple agent frameworks, different integration methods, one unified dashboard. This is the vendor-neutral advantage.
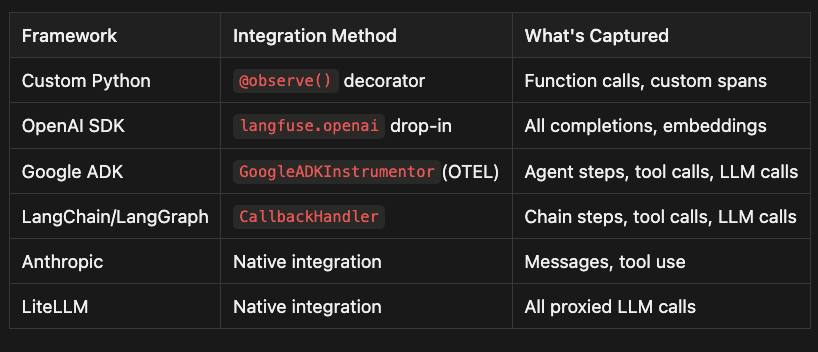
Custom Python
- Integration method: Add Langfuse's
@observe()decorator to your own Python functions. - What it captures: A span per function call, nested automatically based on your call stack, plus timing and errors.
- Best for: Business logic you control and want to name and structure explicitly.
- Notes: Combine with
propagate_attributes()to attachuser_id,session_id, tags, and metadata to the whole subtree.
OpenAI SDK
- Integration method: Swap
from openai import OpenAItofrom langfuse.openai import OpenAIas a drop-in replacement. - What it captures: Each model call as a generation, including prompts, completions, model parameters, latency, token counts, and cost. It also captures embeddings calls when used.
- Best for: Quick wins and broad coverage when your app already uses the OpenAI Python SDK directly.
- Notes: Works especially well alongside
@observe()so generations appear inside your higher-level spans.
Google ADK
- Integration method: OpenTelemetry auto-instrumentation using
GoogleADKInstrumentor()with an OTLP exporter configured to Langfuse. - What it captures: Framework-level agent steps, tool dispatch, and LLM calls without modifying your agent code.
- Best for: Seeing inside ADK orchestration, not just your wrapper functions.
- Notes: Configure the exporter to send traces to
/api/public/otel/v1/tracesand includex-langfuse-ingestion-versionso traces show up quickly.
LangChain and LangGraph
- Integration method: Add the Langfuse
CallbackHandlervia the framework's callbacks mechanism. - What it captures: Chain and graph execution events, tool calls, and LLM calls, mapped into Langfuse observations.
- Best for: LangChain based pipelines where callbacks are the standard extension point.
- Notes: Pass callbacks at invocation time or attach them to the compiled graph so the full run is captured.
Anthropic
- Integration method: Native integration in Langfuse.
- What it captures: Anthropic Messages API inputs and outputs, including tool use events, timing, and token usage when available.
- Best for: Apps built on Claude where you want first-class visibility without building custom wrappers.
- Notes: Pair with tags and metadata so you can slice traces by environment, experiment, or customer tier.
LiteLLM
- Integration method: Native integration via the LiteLLM proxy layer.
- What it captures: All proxied LLM calls across providers, normalized into consistent observations with usage and latency.
- Best for: Multi-provider setups where you want one place to observe OpenAI, Anthropic, Gemini, and others.
- Notes: Especially useful for comparing cost and latency across models because calls are routed through a single surface.
If you're running a production system like mine, you probably have agents built with different frameworks. Maybe your research agent uses LangGraph, your customer support agent is custom Python with the OpenAI SDK, and you're experimenting with Google ADK for a new use case. With Langfuse, all of these agents report to the same dashboard. One place to monitor costs, debug failures, and compare performance across your entire agent fleet.
In my Google ADK Practitioner's Guide series, I walk through building production agents with ADK's built-in tool orchestration. Adding Langfuse observability to those agents is the OTEL instrumentor setup shown earlier in this article. Nothing more.
Key Takeaways
- Two instrumentation paths:
@observe()for custom code, OTEL instrumentors for frameworks. Most production systems use both. - Traces auto-capture everything: Input, output, latency, token usage, cost per step. You get this with two import lines.
- Enrich for production:
user_id,session_id, tags, and metadata transform traces from debugging data into operational intelligence. - One dashboard for all frameworks: Langfuse is framework-agnostic. Every agent, regardless of how it's built, reports to the same place.
- 30 minutes from zero to full visibility: That's not marketing. That's what you just did.
What's Next
Tracing shows you what happened. But knowing what happened isn't the same as knowing whether it was any good. In the next article, we'll cover evaluating agents in production: LLM-as-a-Judge scoring, dataset-driven testing, and the feedback loops that turn observability data into actual improvements. Spoiler: Langfuse has built-in evaluation primitives that make this surprisingly straightforward.
This is Article 2 of the Langfuse Series: Agent Observability for the Practitioner. Read Article 1 for the "why" behind agent tracing, and stay tuned for Article 3 on production evaluation.
About the Author
Rick Hightower is a hands-on agent architect, AI agent engineer and technical writer who builds with LangGraph, Claude Agent SDK, CrewAI, and more.
He created skilz, the universal agent skill installer, supporting 30+ coding agents including Claude Code, Gemini, Copilot, and Cursor, and co-founded the world's largest agentic skill marketplace. Connect with Rick Hightower on LinkedIn or Medium. Check out SpillWave, your source for AI expertise.
Rick has been actively developing generative AI systems, agents, and agentic workflows for years. He is the author of numerous agentic frameworks and developer tools and brings deep practical expertise to teams looking to adopt AI. He enjoys writing about himself in the 3rd person.
Rick also wrote a Claude Certified Architect (CCA) series of articles that have a lot of useful information on writing agentic AI systems.
CCA Exam Prep on Agentic Development
- Claude Certified Architect: The Complete Guide to Passing the CCA Foundations Exam
- CCA Exam Prep: Mastering the Code Generation with Claude Code Scenario
- CCA Exam Prep: Mastering the Multi-Agent Research System Scenario
- CCA Exam Prep: Structured Data Extraction
- CCA: Master the Developer Productivity Scenario
- Claude Certified Architect: Master the CI/CD Scenario
- CCA Exam Prep: Mastering the Customer Support Resolution Agent Scenario
Harness Engineering Articles
- The $9 Disaster: What Anthropic's Harness Design Paper Teaches Us About Building Autonomous AI
- Harness Engineering vs Context Engineering: The Model is the CPU, the Harness is the OS
- LangChain Deep Agents: Harness and Context Engineering: Memory, Skills, and Security
- Beyond the AI Coding Hangover: How Harness Engineering Prevents the Next Outage
- LangChain's Harness Engineering: From Top 30 to Top 5 on Terminal Bench 2.0
- Anthropic's Harness Engineering: Two Agents, One Feature List, Zero Context Overflow
- OpenAI's Harness Engineering Experiment: Zero Manually-Written Code