Scientific Debugging with AI: How GSD's /gsd:debug Command Works
Stop vibe debugging. Start engineering.
Originally published on Medium.
 Scientific Debugging with AI
Stop vibe debugging. Start engineering.
The GSD framework's /gsd:debug command replaces chaotic AI debugging with scientific methodology: falsifiable hypotheses, 8 investigation techniques, persistent debug files, and isolated context windows.
You paste a stack trace into AI. It rewrites half your file. Three rounds later, context is full of failures. There is a better way.
Picture this: you paste a stack trace into an AI assistant, type "fix this," and the AI rewrites half your file. It still does not work. You paste the new error. The AI rewrites again. Three rounds later, the context window is packed with failed attempts, the AI is hallucinating variable names, and you are further from a working program than when you started.
This pattern has a name: vibe debugging. It is the default experience when developers bring real bugs to AI coding assistants.
The problem is not the AI's intelligence. The problem is the approach. Experienced engineers debug systematically. They form hypotheses, run controlled tests, record evidence, and eliminate dead ends. But when those same engineers turn to an AI assistant for help, they abandon all of that discipline and fall back to paste-and-pray.
The GSD (Get Shit Done) framework for Claude Code takes a fundamentally different approach. Its /gsd:debug command treats debugging as engineering, not guessing. This article explains exactly how it works and why the design choices produce better results.
I promise you this: If you have a tough timing issue or other really complicated debugging issues, this tool feels like magic. It is probably one of the best features of GSD.
What Is /gsd:debug?
The /gsd:debug command is a dedicated utility for investigating deep, systemic, or pre-existing architectural bugs. It is part of the GSD framework: an open-source meta-prompting system that orchestrates Claude Code, Gemini CLI and OpenCode through specialized subagents, fresh context windows, and atomic version control.
The key distinction: /gsd:debug is not for quick fixes.
GSD already handles routine bugs through its /gsd:verify-work command, which catches regressions during phase-level User Acceptance Testing (UAT). When UAT catches a bug, the system auto-spawns temporary debug agents to diagnose and fix it inline. That path is fast and lightweight.
But some bugs require real investigation: brownfield code where the original author is gone, a race condition that only appears under production load, an intermittent failure that resists reproduction, or a regression introduced three months ago that only surfaced today. For those bugs, you reach for /gsd:debug.
The key architectural difference is isolation. UAT debugging happens within the current context. /gsd:debug creates a completely separate debugging environment with its own fresh 200,000-token context window, persistent state files, and a specialized agent prompt engineered specifically for investigation. The main conversation stays clean throughout the entire session.
Architecture: The Thin Orchestrator Pattern
The /gsd:debug command is roughly 165 lines of orchestration logic. It does not investigate anything directly. Instead, it acts as a project manager that sets up the debugging session and hands off to a specialist.
This is the "thin orchestrator" pattern that runs throughout GSD's design. The orchestrator gathers structured input, resolves the right tools and models, and spawns the appropriate subagent. The subagent does the actual work in its own context window. This separation produces two benefits: the orchestrator stays lightweight and reusable, and the subagent gets a clean slate optimized for its specific task.
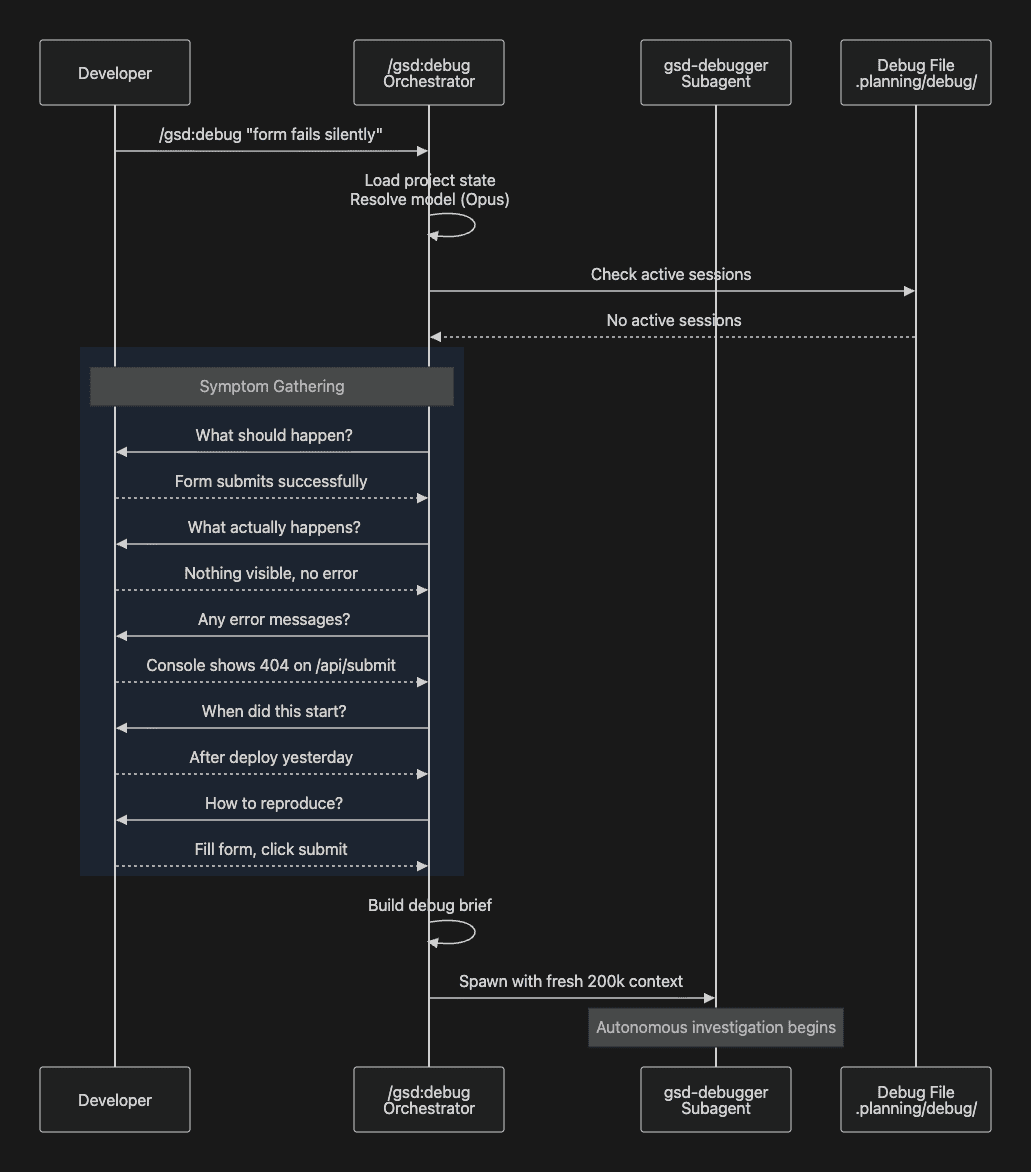
Symptom Gathering
When you invoke /gsd:debug "form submission fails silently", the orchestrator first checks for any active debug sessions in .planning/debug/. If none exist, it gathers symptoms through five structured questions:
- Expected behavior -- What should happen?
- Actual behavior -- What happens instead?
- Error messages -- Any errors you can see?
- Timeline -- When did this start? Did it ever work?
- Reproduction steps -- How do you trigger it?
These five questions might look simple, but they do something important: they force a distinction between symptoms and diagnosis. Developers instinctively jump to explaining what they think is wrong. The structured intake redirects them to describing what they observed. That distinction matters because a developer's early diagnosis is often wrong, and baking a bad diagnosis into the prompt causes the AI to investigate the wrong thing.
Context Consolidation and Spawning
After gathering symptoms, the orchestrator resolves the optimal AI model (typically Opus for complex investigations or Gemini Pro or Codex High), builds a structured debug brief, and spawns the gsd-debugger subagent:
Task(
  prompt=filled_prompt,
  subagent_type="gsd-debugger",
  model="opus",
  description="Debug form-submission-fails"
)
Side Note: Task is renamed to Agent in the latest Claude Code while OpenCode and Gemini have their equivalent.
The subagent launches with a fresh 200,000-token context window containing only the structured symptoms and the full debugging methodology. No prior conversation history. No accumulated noise from previous failed attempts. Just the problem description and the tools to solve it.
The gsd-debugger: 990 Lines of Scientific Method
The gsd-debugger agent is not a generic "fix bugs" prompt. It is a 990-line system prompt that encodes a complete scientific debugging methodology, including cognitive bias awareness, hypothesis testing frameworks, eight investigation techniques, and persistent state management.
The size reflects a deliberate design philosophy: vague instructions produce vague behavior. When you tell an AI to "debug carefully," it has no operational definition of what careful means. When you encode specific cognitive biases to watch for, a specific hypothesis testing protocol, and eight named investigation techniques with explicit decision criteria, the AI has concrete procedures to follow. The length is doing real work.
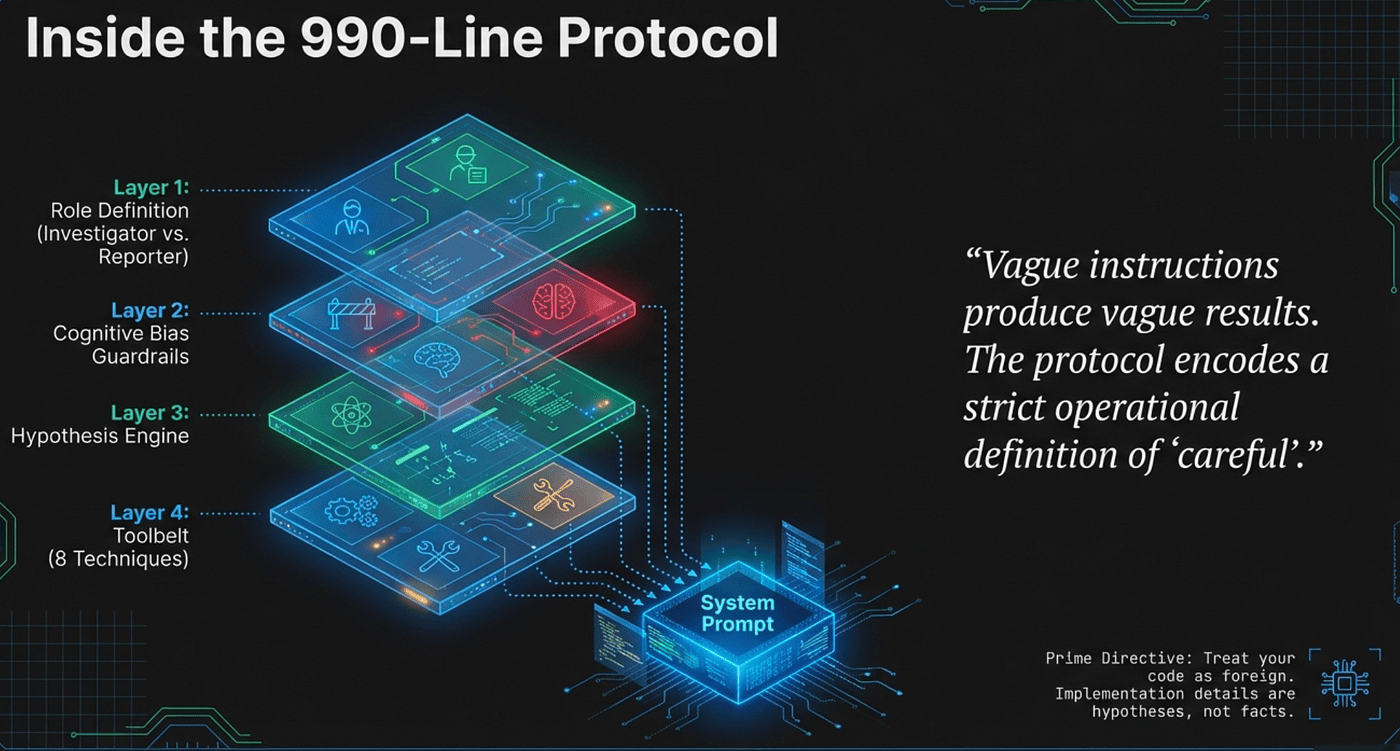 Inside the 990-Line Protocol
Philosophy: Reporter vs. Investigator
The agent operates on a clear division of labor. The developer is the reporter: they know what they expected, what actually happened, what errors they saw, and when the problem started. The agent is the investigator: it reads code, runs tests, forms hypotheses, and traces causes.
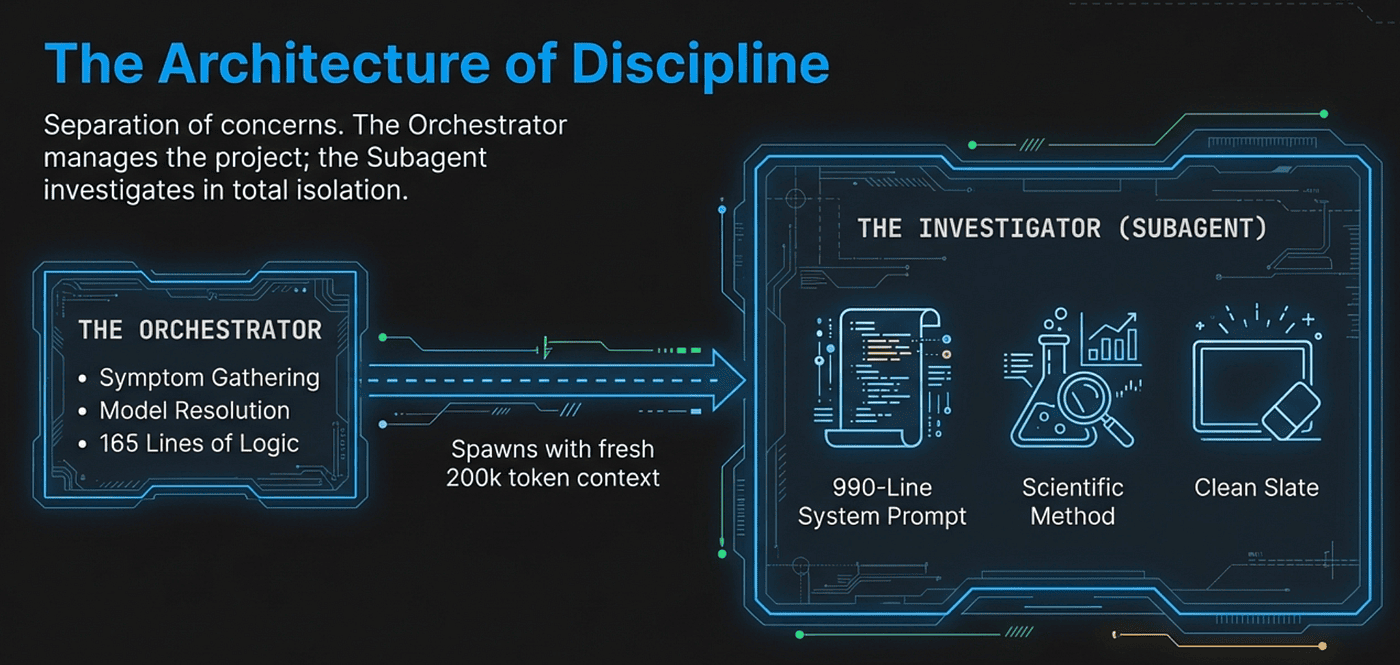 The Architecture of Discipline
This division matters because it prevents two common failure modes. First, it stops the agent from asking the developer to diagnose the bug ("what do you think is causing this?"), which defeats the purpose of having an AI investigator. Second, when the agent debugs code that Claude wrote in a previous session, it applies special discipline:
"Treat your code as foreign. Read it as if someone else wrote it. Your implementation decisions are hypotheses, not facts. The code's behavior is truth; your model is a guess."
This instruction directly combats a subtle but serious problem. An AI that wrote the code in session A will have a strong prior that its own implementation is correct. When that same AI debugs the code in session B, it may unconsciously protect its earlier decisions and investigate around them rather than investigating them. The "treat it as foreign" instruction breaks that pattern.
Cognitive Bias Awareness
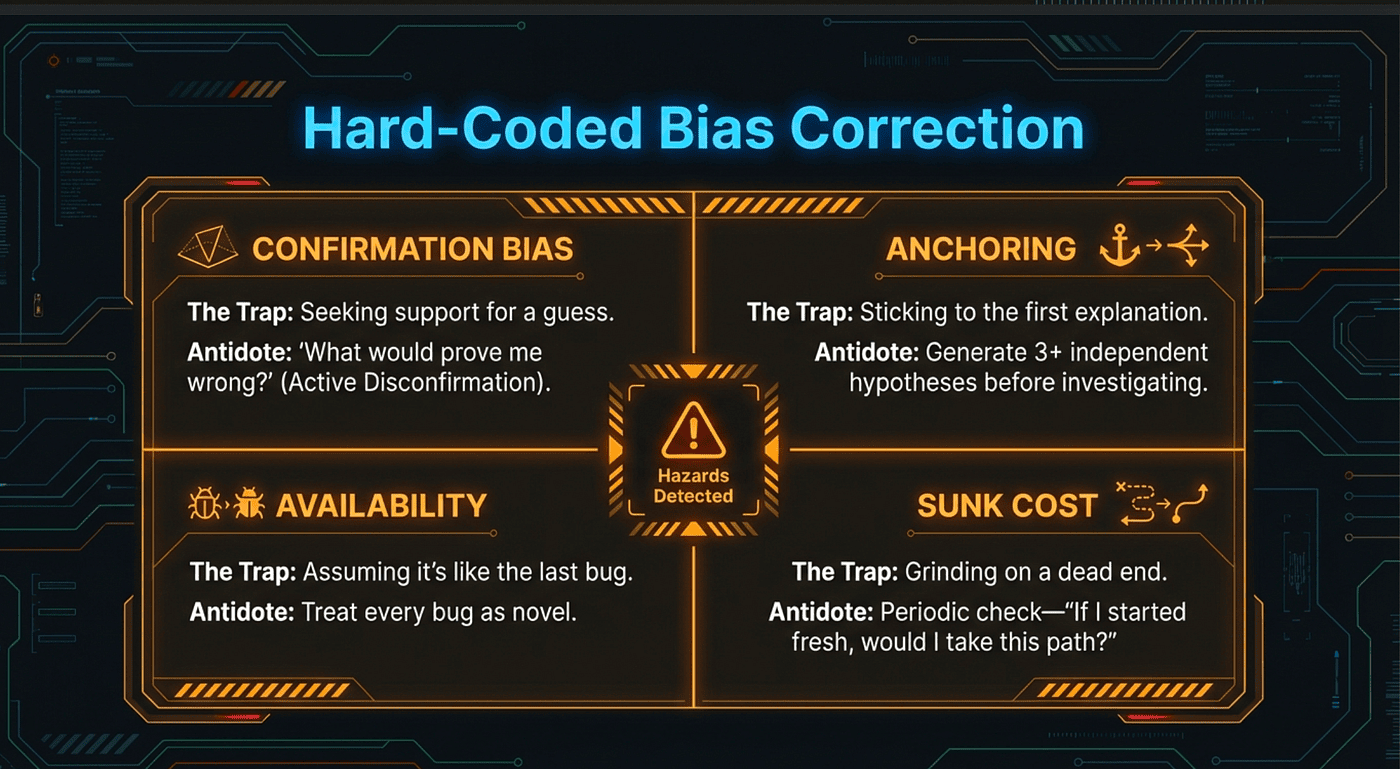
The agent prompt includes an explicit cognitive bias table, training the AI to recognize and counteract common traps:
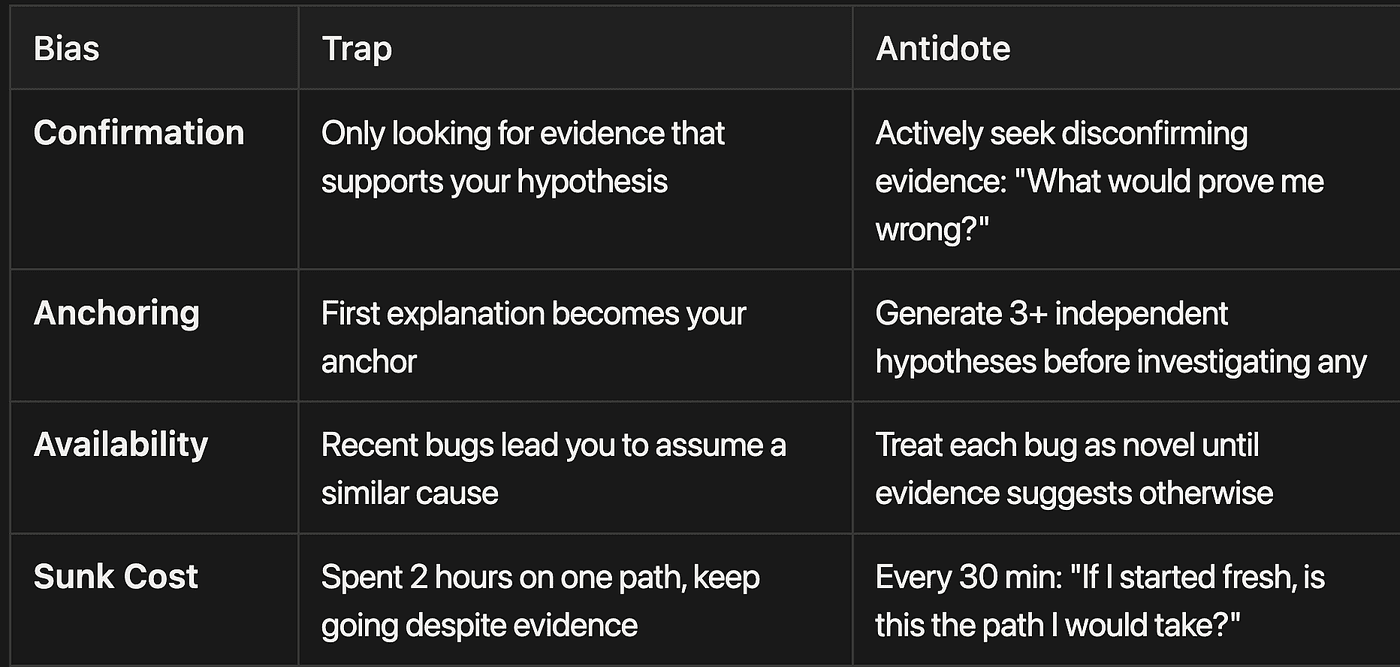
Confirmation Bias
- Trap: Only looking for evidence that supports your hypothesis
- Antidote: Actively seek disconfirming evidence: "What would prove me wrong?"
Anchoring Bias
- Trap: First explanation becomes your anchor
- Antidote: Generate 3+ independent hypotheses before investigating any
Availability Bias
- Trap: Recent bugs lead you to assume a similar cause
- Antidote: Treat each bug as novel until evidence suggests otherwise
Sunk Cost Fallacy
- Trap: Spent 2 hours on one path, keep going despite evidence
- Antidote: Every 30 min: "If I started fresh, is this the path I would take?"
These are not theoretical concerns. They describe the exact failure modes that derail AI debugging sessions in practice.
 Hard-Coded Bias Correction
Confirmation bias is the most dangerous one. An AI assistant that lands on one plausible explanation will tend to interpret subsequent evidence in its favor. Every error message becomes confirmation of the initial hypothesis. Contradictory evidence gets minimized. The "What would prove me wrong?" prompt forces the agent to actively seek disconfirmation rather than just confirmation.
Anchoring explains why you should never let the developer's initial guess become the investigation's first hypothesis. If the developer says "I think it's a caching issue" and the agent starts there, the entire investigation anchors to that starting point. The instruction to generate three or more independent hypotheses before investigating any of them breaks the anchor.
The Hypothesis Testing Framework
At the core of the scientific methodology is a formal hypothesis testing framework with a strict falsifiability requirement. This is where the approach diverges most sharply from typical AI debugging.
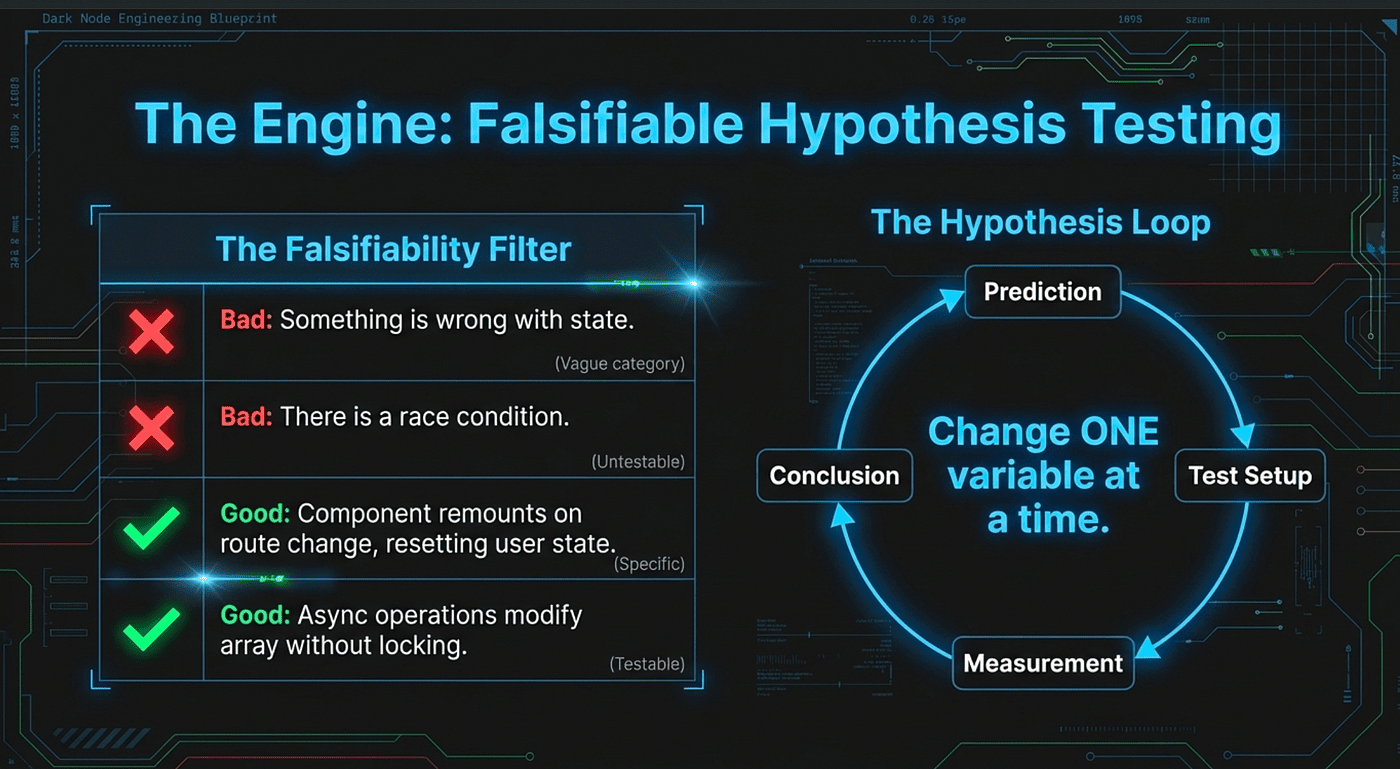
Bad hypotheses (unfalsifiable):
- "Something is wrong with the state"
- "The timing is off"
- "There is a race condition somewhere"
Good hypotheses (falsifiable):
- "User state resets because the component remounts when the route changes"
- "The API call completes after unmount, causing a state update on an unmounted component"
- "Two async operations modify the same array without locking, causing data loss"
The difference is specificity. Each good hypothesis makes a testable claim. You can examine the component lifecycle and verify whether it remounts on route changes. You can add a log after unmount and watch for state updates. You can check whether the array operations acquire locks.
 Falsifiable Hypothesis Testing
The unfalsifiable versions cannot be tested because they do not predict anything specific enough to observe. "Something is wrong with the state" is consistent with any state-related outcome. It is not a hypothesis; it is a category.
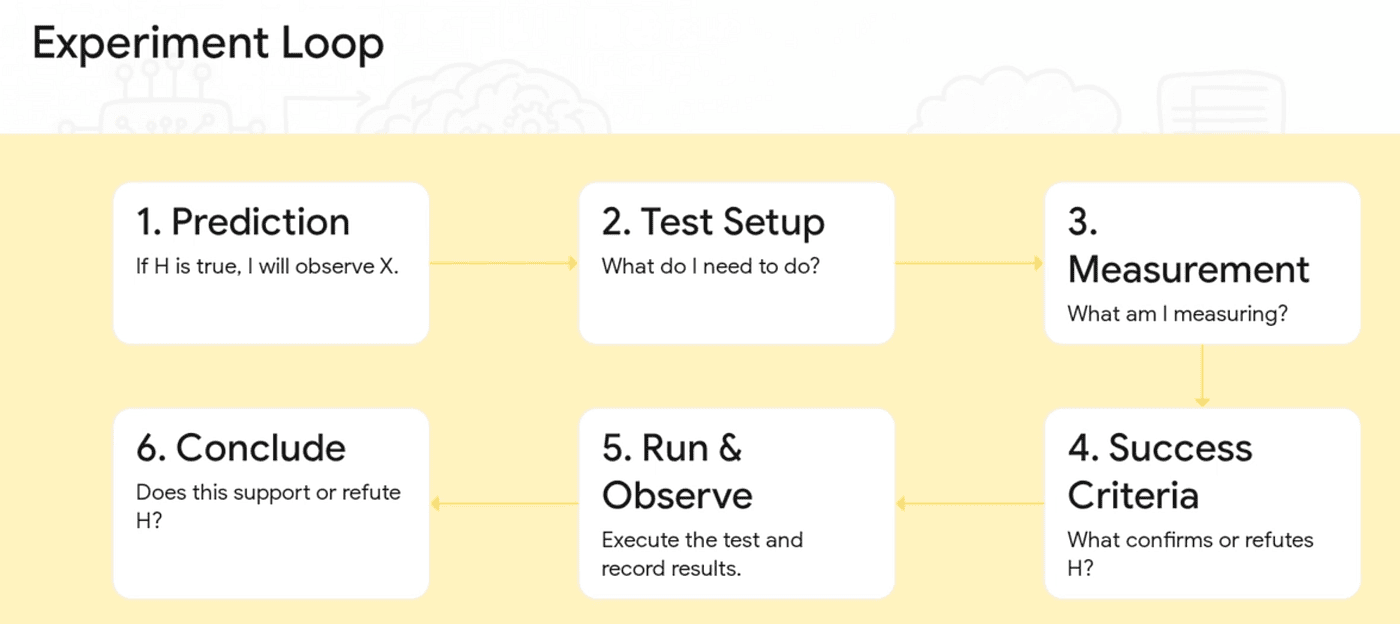
For each hypothesis, the agent follows a structured experimental design:
- Prediction -- If H is true, I will observe X
- Test setup -- What do I need to do?
- Measurement -- What exactly am I measuring?
- Success criteria -- What confirms H? What refutes H?
- Run -- Execute the test
- Observe -- Record what actually happened
- Conclude -- Does this support or refute H?
One hypothesis at a time. One change at a time. This constraint is non-negotiable. If you change three things simultaneously and the bug disappears, you have learned nothing about which change fixed it. You cannot revert safely. You cannot generalize the fix. You have an unreliable patch, not a diagnosis.
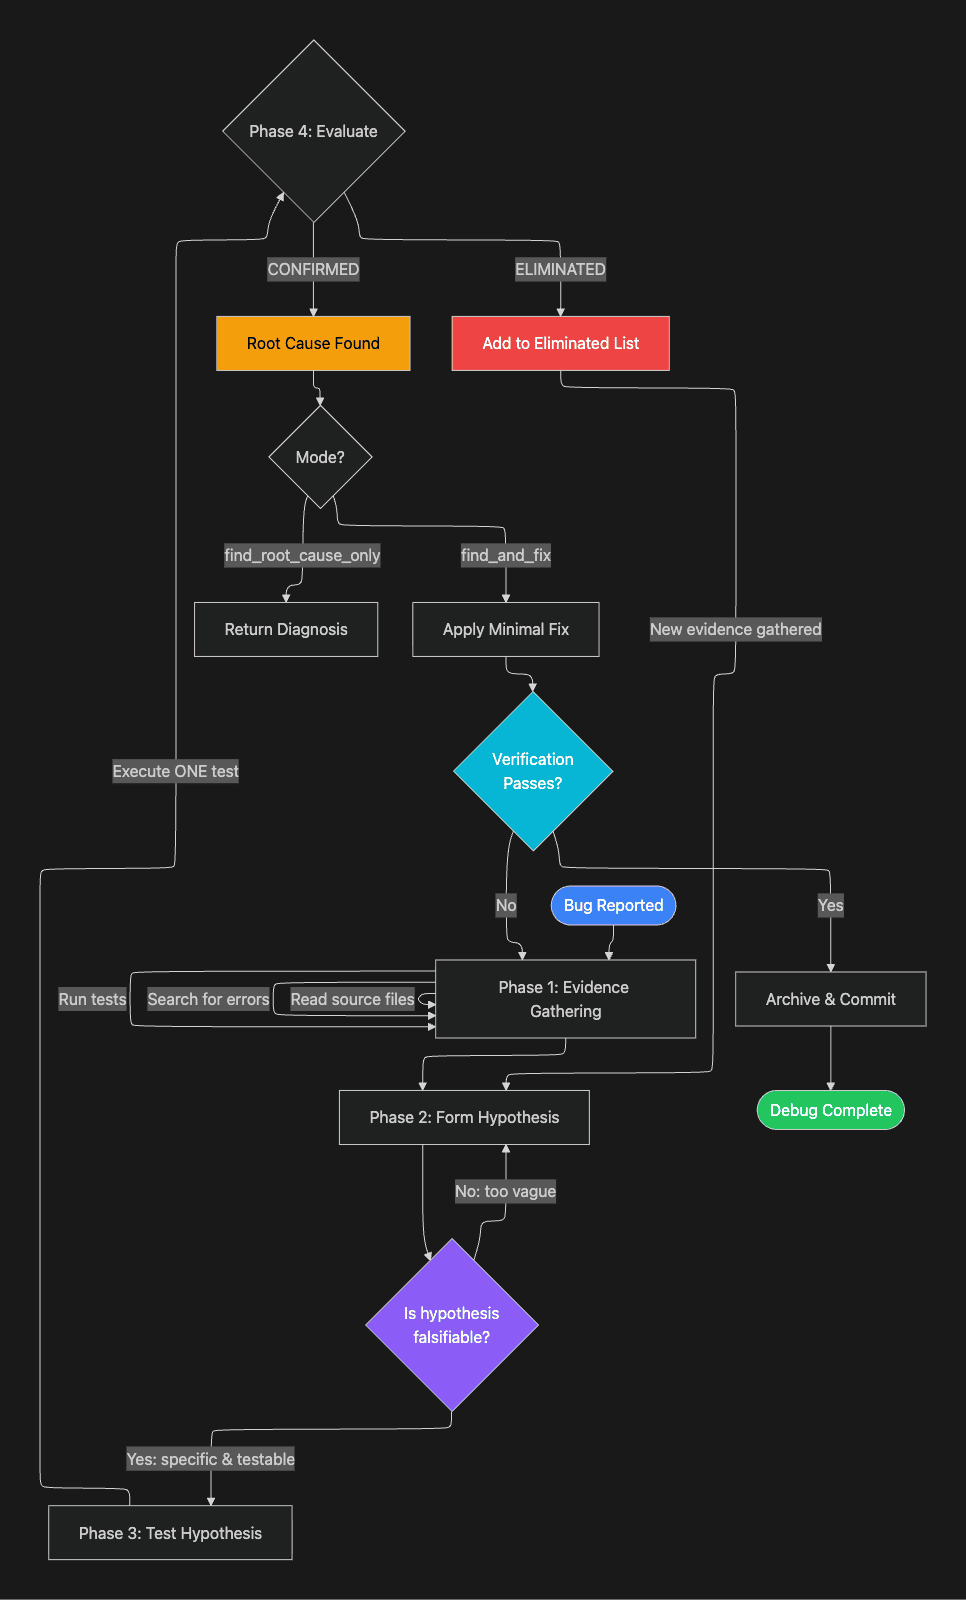
Notice the loop: eliminated hypotheses generate new evidence, which feeds back into forming the next hypothesis. Each failed hypothesis is not wasted effort. It narrows the search space and often reveals information that points toward the real cause. Divide and conquer. This is the way.
Eight Investigation Techniques
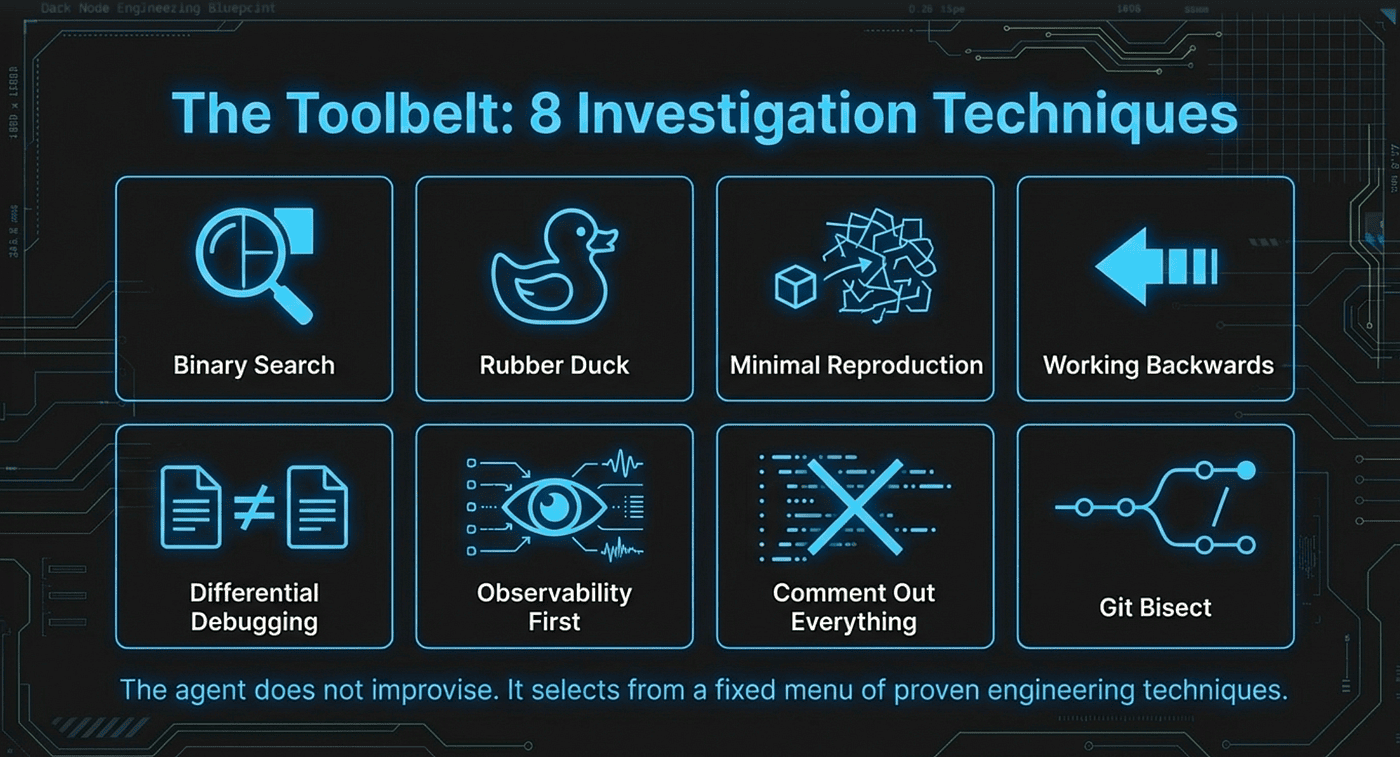
The gsd-debugger carries eight named investigation techniques, each with clear guidance on when to apply it. Having named techniques matters because it gives the agent a decision framework rather than leaving it to improvise. When the agent asks itself "what should I try next?", it can systematically evaluate each technique against the current situation rather than guessing.
 The Toolbelt: 8 Investigation Techniques
1. Binary Search / Divide and Conquer
When to use: Large codebase, long execution path, many possible failure points.
How it works: Cut the problem space in half repeatedly. Test the midpoint. If it passes, the bug is in the second half. If it fails, the bug is in the first half. Repeat until you have isolated the exact location.
Example: The API returns wrong data.
Does the data leave the database correctly? Yes.
Does it reach the frontend correctly? No.
Does it leave the API route correctly? Yes.
Does it survive serialization? No.
Four tests eliminated 90% of the codebase and identified the serialization layer as the culprit.
Trade-off: Binary search works well when you can test arbitrary midpoints. It works poorly when the execution path has side effects that make isolated testing difficult.
2. Rubber Duck Debugging
When to use: Stuck, confused, mental model does not match observed behavior.
How it works: Explain the problem out loud in complete detail, from first principles. The act of articulating often surfaces hidden assumptions. "Wait, I never actually verified that step B returns what I think it does."
Why it works: Bugs frequently live in the gap between what you believe the code does and what it actually does. Narrating forces you to make implicit beliefs explicit, where they can be examined.
3. Minimal Reproduction
When to use: Complex system with many moving parts, unclear which part fails.
How it works: Strip away everything until the smallest possible code reproduces the bug. A 500-line React component with 15 props, 8 hooks, and 3 contexts becomes a 6-line component that exposes an infinite loop from a missing dependency array.
Trade-off: Minimal reproduction is highly reliable when successful, but it can be time-consuming for bugs that depend on complex system interactions. Some bugs simply do not survive extraction from their context. In those cases, Differential Debugging or Observability First may be more practical.
4. Working Backwards
When to use: You know the correct output but are not getting it.
How it works: Start from the desired end state and trace backwards through the call stack, checking each step against expectations.
Example: The UI shows "User not found" when the user exists.
Trace: UI displays user.error (rendering is correct) -> API returns { error: "User not found" } -> Database query: SELECT * FROM users WHERE id = 'undefined'.
The user ID is the string 'undefined' instead of a number. The bug is in how the ID gets passed to the API call, not in the UI or database.
Working backwards is efficient because it lets you skip layers that are provably correct. Once you confirm the rendering logic is fine, you stop investigating it and move upstream.
5. Differential Debugging
When to use: Something used to work and now does not, or works in one environment but not another.
How it works: List all differences between the working and broken states. Test each difference in isolation to identify which one causes the failure.
Example: Works locally, fails in CI. Differences: Node version (same), environment variables (same), timezone (different). Set local timezone to UTC, and now it fails locally too. The date comparison logic assumed local timezone.
Why this is powerful: Differential debugging converts an unclear "why is it broken" question into a concrete "which difference explains the behavior" question. The second question is much easier to answer systematically.
6. Observability First
When to use: Always. Before making any code change.
How it works: Add visibility before changing behavior. Strategic logging at key points, assertion checks, timing measurements, and stack traces at critical junctions. Observe the system's actual behavior, then form hypotheses based on what you see.
This technique deserves its own principle: never change code you cannot observe. If you fix a bug without first understanding what the code is actually doing, you are guessing. Observability converts guessing into measurement. Measure before you change.
7. Comment Out Everything
When to use: Many possible interactions, unclear which code causes the issue.
How it works: Comment out all suspect code, verify the bug is gone, then uncomment one piece at a time until the bug returns. The piece that brings the bug back is the culprit.
Example: Eight middleware functions. Uncomment them one by one. The bug returns when bodyParser.json({ limit: '50mb' }) is added. Finding: that middleware causes memory pressure under the current load pattern.
Trade-off: This technique works well for additive systems like middleware pipelines or event handlers. It is harder to apply when pieces are tightly coupled and cannot be safely removed in isolation.
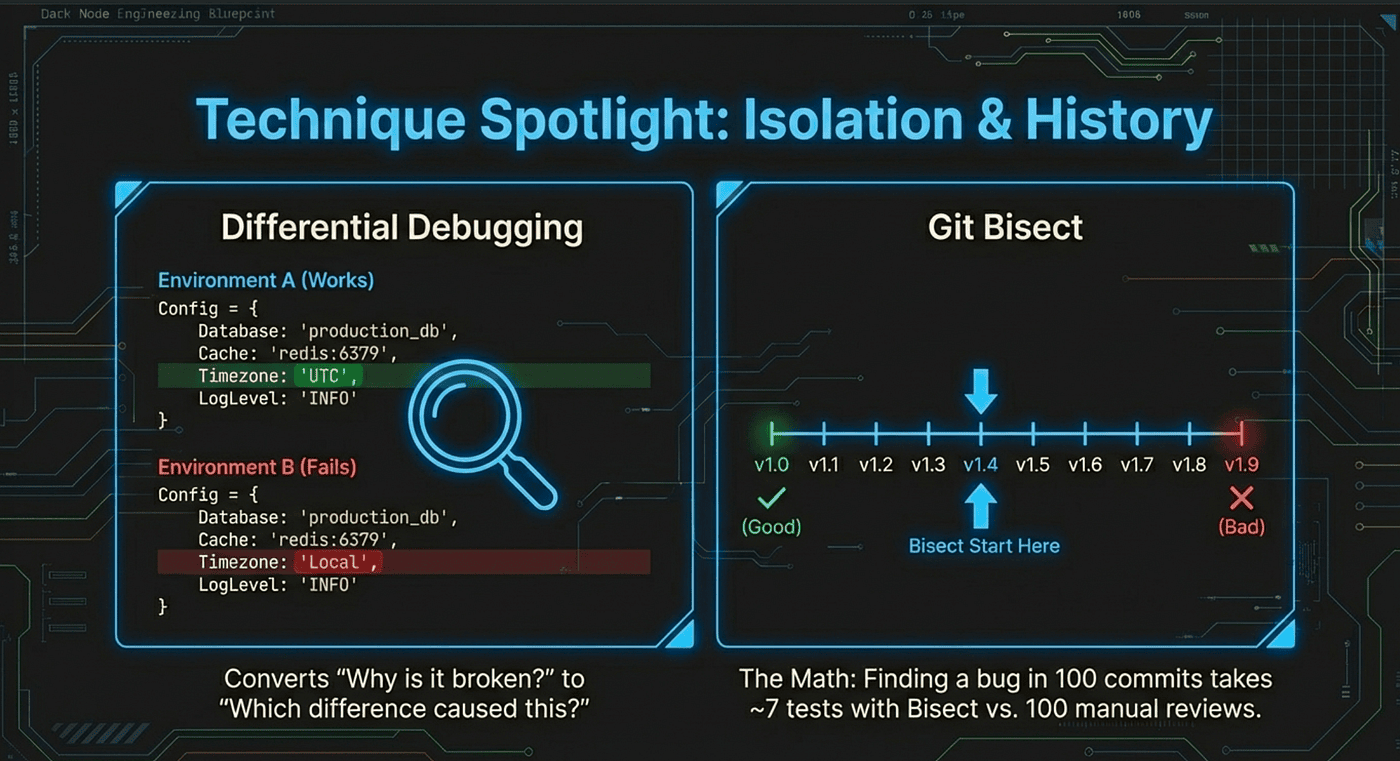
8. Git Bisect
When to use: A feature worked at a known past commit and broke at an unknown later commit.
How it works: Binary search through git history. Mark a known good commit and the current broken commit. Git bisect checks out the midpoint. You test and mark it good or bad. Repeat until you find the exact breaking commit.
Why it matters: With 100 commits between working and broken, git bisect finds the culprit in about 7 tests. Without bisect, you would review all 100 commits. The breaking commit reveals exactly what changed, which usually makes the root cause obvious.
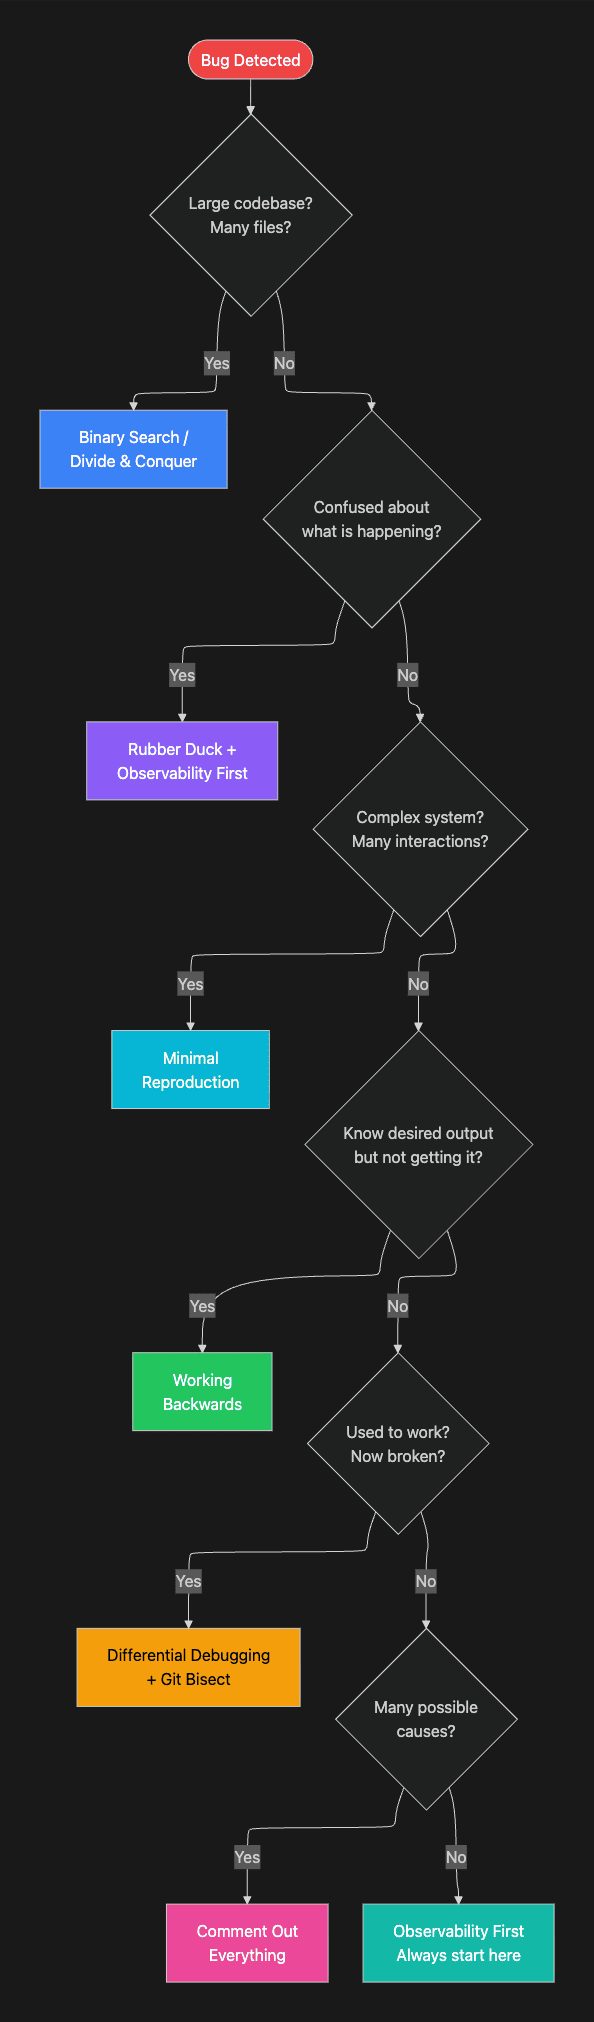
The decision tree makes technique selection explicit. Rather than leaving the agent to choose arbitrarily, the tree encodes the situational logic that an experienced debugger applies.
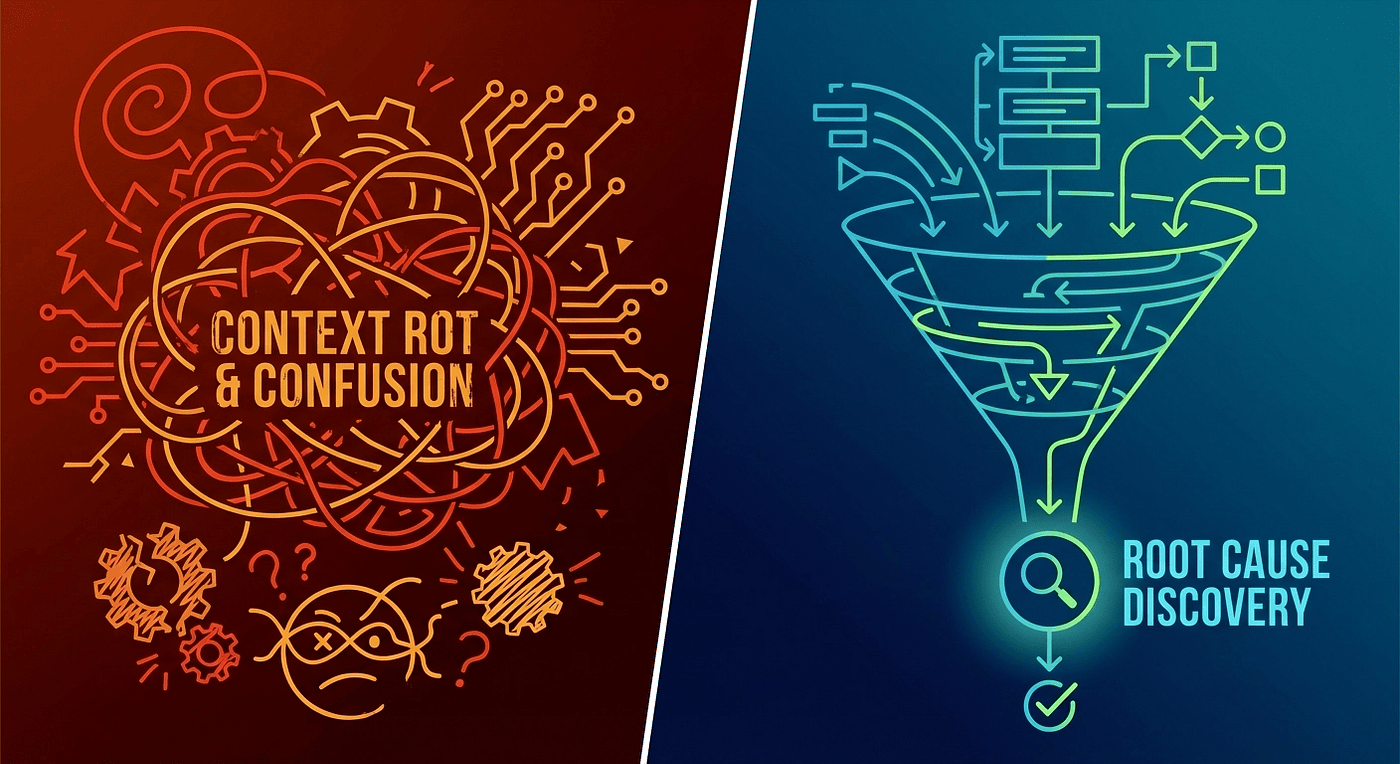 From chaos to order: scientific debugging narrows the search space systematically
The Debug File Protocol: Memory That Survives Context Resets
One of the most critical design decisions in /gsd:debug is the persistent debug file. Context limits are a real constraint during deep investigation. When a debugging session runs out of context, the default outcome is total loss: every hypothesis formed, every piece of evidence gathered, every dead end eliminated. The developer is back at the beginning.
 Black Box Persistent Memory
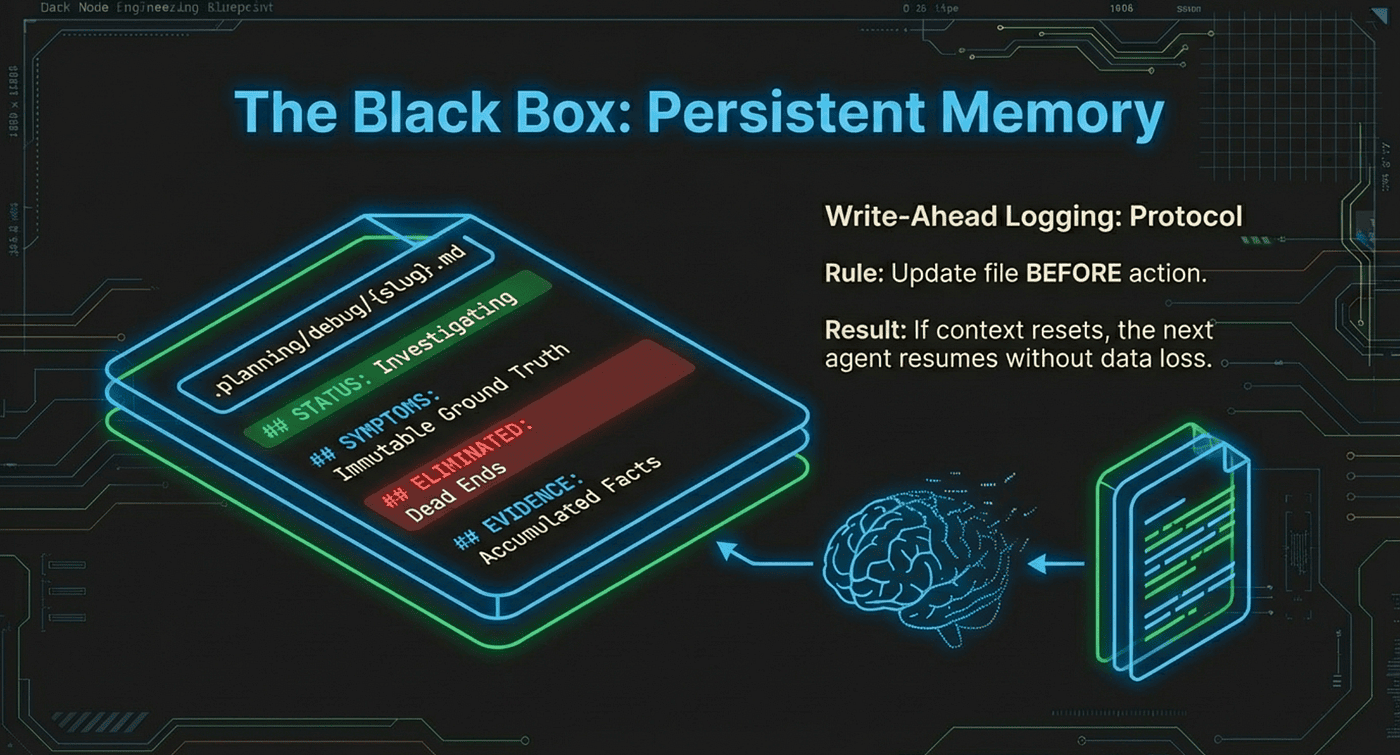
The gsd-debugger solves this with a structured markdown file at .planning/debug/{slug}.md that acts as the investigation's persistent memory. The AI agents are disposable. The file is not.
File Structure
---
status: investigating
trigger: "form submission fails silently"
created: 2026-02-25T10:30:00Z
updated: 2026-02-25T11:15:00Z
---

## Current Focus
hypothesis: API route /api/submit was renamed in recent deploy
test: Check git diff for route changes in last 5 commits
expecting: Route name mismatch between frontend and backend
next_action: Run git log --oneline -5 -- src/routes/

## Symptoms
expected: Form submits successfully with confirmation
actual: Click submit, nothing happens, no visible error
errors: Console shows 404 on POST /api/submit
reproduction: Fill any form field, click submit button
started: After yesterday's deploy

## Eliminated
- hypothesis: Frontend validation blocking submission
  evidence: No validation errors in console, form data is valid
  timestamp: 2026-02-25T10:45:00Z

- hypothesis: CORS blocking the request
  evidence: No CORS errors in console, same-origin request
  timestamp: 2026-02-25T10:52:00Z

## Evidence
- timestamp: 2026-02-25T10:40:00Z
  checked: Browser network tab
  found: POST to /api/submit returns 404
  implication: Route does not exist on server

- timestamp: 2026-02-25T10:55:00Z
  checked: src/routes/index.ts
  found: Route is /api/v2/submit (changed in commit abc123)
  implication: Frontend still points to old route
Each section serves a specific purpose. Current Focus tells the next agent exactly where the investigation stands and what to do first. Symptoms are the ground truth that never changes. Eliminated is the list of dead ends that the next agent must not revisit. Evidence is the accumulated observations that support hypothesis formation.
Update Rules
Each section has strict update rules that prevent corruption:
- Current Focus: OVERWRITE -- Always reflects the current state of investigation
- Symptoms: IMMUTABLE -- The original problem never changes
- Eliminated: APPEND only -- Prevents re-investigating dead ends
- Evidence: APPEND only -- Every finding is preserved
- Resolution: OVERWRITE -- Understanding evolves as investigation progresses
The most important rule is not about a specific section. It is about timing. The agent must update the file before taking action, not after. If context resets in the middle of an action, the file shows what was about to happen. That is enough to resume. If the agent updates after the action and context resets during the action, the file shows nothing about the current state, which is not enough to resume.
- This write-before-act discipline is the same principle behind write-ahead logging in databases. The log entry exists before the operation, so recovery is always possible.
Resume Behavior
When you run /clear and invoke /gsd:debug again, the orchestrator finds the active session, reads the file, and spawns a fresh agent with the complete investigation state. The new agent reads:
- Status to know what phase it is in
- Current Focus to know exactly what was happening
- Eliminated to know what not to retry
- Evidence to know what has been learned
- Next action to continue exactly where the previous agent left off
The fresh agent picks up the investigation as if it had been there the whole time. This design treats AI context windows as a disposable resource, which they are, and persistent files as the durable state, which they should be.
Checkpoints: When the AI Needs You
Autonomous investigation has limits. Some information is only available through human observation: whether an admin account exhibits different behavior, what a third-party service returns in the actual production environment, or which of two investigation paths is worth the time investment.
Rather than guessing or halting silently, the debugger returns a structured checkpoint to the orchestrator, which presents it to the developer. Three checkpoint types exist:
human-verify -- The agent needs you to confirm something it cannot observe directly. "Can you check if the form submission succeeds when you log in as an admin user?"
human-action -- The agent needs you to perform an action. "Please restart the development server with the DEBUG=true flag and paste the output."
decision -- The agent needs you to choose an investigation direction. "The bug could be in the caching layer or the database connection pool. Investigating both would take significant time. Which should I prioritize?"
After you respond, the orchestrator spawns a fresh continuation agent with the debug file plus your response. The original agent is never resumed. Each continuation starts with a clean context window, preventing the accumulated confusion that makes long debugging sessions degrade.
This checkpoint design reflects a realistic view of AI capabilities. The agent handles what it can do autonomously: reading code, running tests, tracing execution paths, forming and testing hypotheses. The developer handles what only a human can: physical environment observation, access-controlled systems, and strategic priority calls. The checkpoint mechanism makes that boundary explicit and actionable.
Resolution: Fix, Verify, Archive
When root cause is confirmed, the agent follows a strict resolution protocol. Each step prevents a specific class of error.
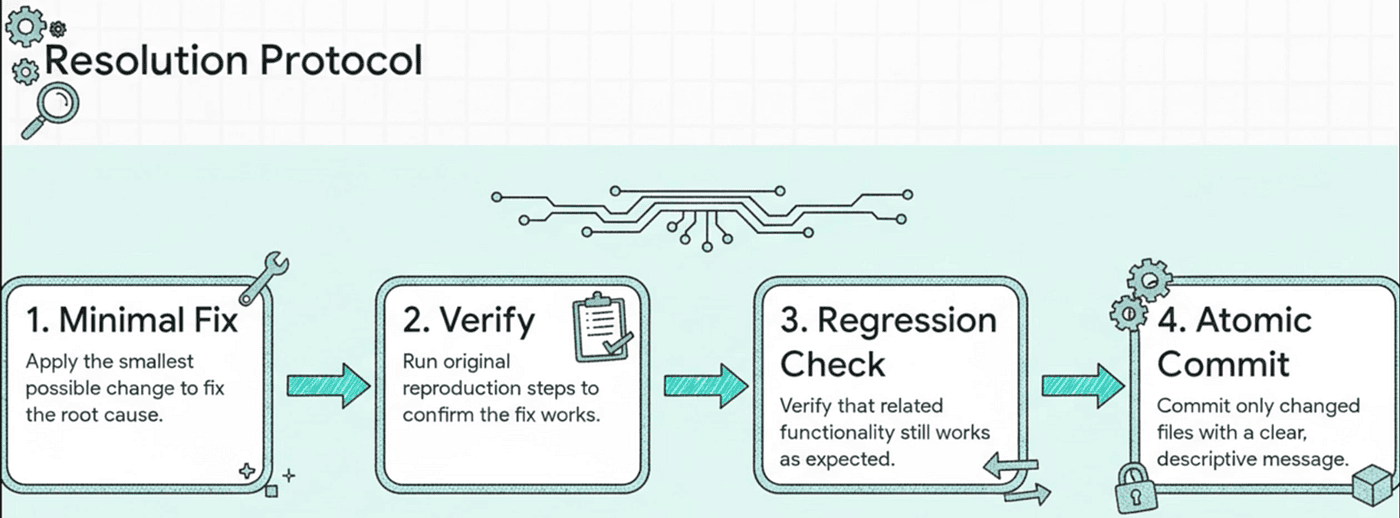
- Minimal fix -- The smallest change that addresses the root cause directly. Not a refactor. Not an improvement. The specific change that eliminates the confirmed cause.
- Verify against symptoms -- Run the exact reproduction steps from the original symptom gathering. The original symptoms are the acceptance criteria. If the reported behavior is gone, the fix works.
- Regression check -- Verify that related functionality still works. A fix that solves one bug and creates two others is not a fix.
- Atomic commit -- Stage only the changed files (never git add -A), commit with a descriptive message that includes the root cause. This creates a commit that is safe to revert in isolation if the fix causes unexpected problems downstream.
- Archive -- Move the debug file to .planning/debug/resolved/. The investigation record is preserved and searchable, but it no longer appears as an active session.
- Human verification -- Present findings for approval before closing. The developer confirms the fix makes sense given their knowledge of the system.
# Code fix commit
git add src/routes/index.ts
git add src/components/Form.tsx
git commit -m "fix: update form submission endpoint to /api/v2/submit

Root cause: API route renamed in v2 migration but frontend not updated"

# Planning docs commit (separate)
node ~/.claude/get-shit-done/bin/gsd-tools.cjs commit \
  "docs: resolve debug form-submission-fails" \
  --files .planning/debug/resolved/form-submission-fails.md
The structured return tells the orchestrator exactly what happened:
## DEBUG COMPLETE

**Root Cause:** API route renamed from /api/submit to /api/v2/submit
  in commit abc123, but frontend Form component still references old path
**Fix Applied:** Updated Form.tsx API endpoint to /api/v2/submit
**Verification:** Form now submits successfully, 200 response, data persisted
**Files Changed:**
- src/routes/index.ts: no change needed (route is correct)
- src/components/Form.tsx: updated API_ENDPOINT constant
**Commit:** def456
The structured output is machine-readable by the orchestrator and human-readable by the developer. It answers the questions a developer needs before accepting a fix: what was wrong, what changed, how was it verified, and what is the commit reference if a revert is needed.
Practical Example: A Complete Session
Here is what a real /gsd:debug session looks like from the developer's perspective:
# Start debugging
> /gsd:debug "user profile photos not loading after S3 migration"

# Orchestrator asks structured questions
? Expected behavior: Profile photos display on user cards
? Actual behavior: Broken image icons on all profile cards
? Error messages: Console shows 403 Forbidden for image URLs
? When did this start: After migrating from local storage to S3
? Reproduction: Visit any user profile page

# Agent investigates autonomously...
# (reads S3 config, checks IAM policies, tests URLs, forms hypotheses)

# Checkpoint returned:
CHECKPOINT: human-verify
"I found the S3 bucket policy allows GetObject only from the
 production domain. Can you confirm: is your dev environment
 using localhost:3000 or a custom domain?"

> localhost:3000

# Fresh agent continues with this information...
# Finds root cause: CORS + bucket policy restrict to production domain only

# Resolution
ROOT CAUSE: S3 bucket policy restricts GetObject to production
  domain. Dev/staging environments return 403 because their
  origins are not in the allowed list.
FIX: Added dev and staging domains to bucket CORS configuration
  and updated bucket policy AllowedOrigins.
COMMIT: abc789

# Debug file archived to .planning/debug/resolved/
Notice what the developer actually did: answered five structured questions, answered one checkpoint question, and approved the result. The agent handled everything else. It read the S3 configuration, formed and tested hypotheses about IAM policies and CORS settings, and identified the exact mismatch between the bucket policy's allowed origins and the development environment's domain.
The developer's main conversation window has no debug noise in it at all. The entire investigation happened in an isolated context window. If you needed to ask the AI something unrelated while the debug session was running, you could, because the debug session lives separately.
Why This Design Produces Better Results
The /gsd:debug command demonstrates something important about AI-assisted development: the quality of AI output depends heavily on the structure you give it.
Unstructured debugging with AI is often worse than debugging alone. You burn context on failed attempts, the AI loses coherence as the context fills with contradictions, and you end up investigating manually after the context window is exhausted. You have lost time and gained nothing.
Structured debugging with /gsd:debug gives the AI four things it would otherwise lack:
A scientific methodology. Falsifiable hypotheses, one-variable-at-a-time testing, and explicit evidence tracking produce reliable results. The cognitive bias table prevents the most common AI failure mode: anchoring on the first plausible explanation and interpreting all subsequent evidence in its favor.
Persistent memory. Debug files survive context resets, session restarts, and agent swaps. The investigation continues even when the underlying AI instance is replaced. The file is the investigation; the agent is just the current worker.
Context isolation. Each investigation gets a fresh 200,000-token window. Failed hypotheses and dead ends do not accumulate in the conversation. Each step of the investigation starts from a clean state informed by the debug file, not polluted by the noise of previous failed attempts.
Clear boundaries. The checkpoint mechanism makes explicit what the AI can handle autonomously and what requires human input. This prevents the agent from guessing about things it cannot observe, which is a common source of AI debugging errors.
The gsd-debugger is not magic. It is discipline, encoded in 990 lines of prompt engineering, wrapped in an architecture designed to keep the AI focused and the developer in control. The results reflect the quality of the structure, not the raw capability of the underlying model.
Key Takeaways
- Vibe debugging fails predictably. Context fills with noise, the AI anchors on early hypotheses, and the investigation degrades rather than converges.
- The thin orchestrator pattern separates coordination from investigation. The command gathers symptoms and spawns the agent. The agent does the actual work in a clean context.
- 990 lines of methodology is not excessive. Vague instructions produce vague behavior. Detailed procedures give the AI something concrete to follow.
- Cognitive bias awareness is operational, not theoretical. The four biases in the table are the actual failure modes that derail AI debugging in practice.
- Falsifiability is a hard requirement. "Something is wrong with state" is not a hypothesis. "The component remounts when the route changes, resetting user state" is a hypothesis.
- The debug file is the investigation; the agent is just the current worker. Files survive context resets. Agents do not.
- Write before act. Update the debug file before taking action, not after. This is write-ahead logging for debugging sessions.
Next Steps
If vibe debugging has been costing you time, the /gsd:debug command is worth trying on your next hard bug.
Start by installing the GSD framework and running the command on a bug you already understand. Watch how the symptom gathering forces precision you might normally skip. Observe how the hypothesis testing framework keeps the investigation focused. If the session gets interrupted, try resuming it with a fresh /gsd:debug invocation and watch the debug file restore the investigation state.
The scientific debugging methodology in the gsd-debugger is also applicable without the tool. The cognitive bias table, the hypothesis testing protocol, and the eight investigation techniques are patterns you can apply manually. The tool just enforces them automatically.
GSD is open source and available at github.com/gsd-build/get-shit-done. The /gsd:debug command requires Claude Code, Gemini CLI or OpenCode with the GSD plugin installed.
About the Author
Rick Hightower is a technology executive and data engineer who led ML/AI development at a Fortune 100 financial services company. He created skilz, the universal agent skill installer, supporting 30+ coding agents including Claude Code, Gemini, Copilot, and Cursor, and co-founded the world's largest agentic skill marketplace. Connect with Rick Hightower on LinkedIn or Medium. Rick has been doing active agent development, GenAI, agents, and agentic workflows for quite a while. He is the author of many agentic frameworks and tools. He brings core deep knowledge to teams who want to adopt AI.