Your Agent Works. Now Prove It: Typed Output, Real Costs, and Traces You Can Search
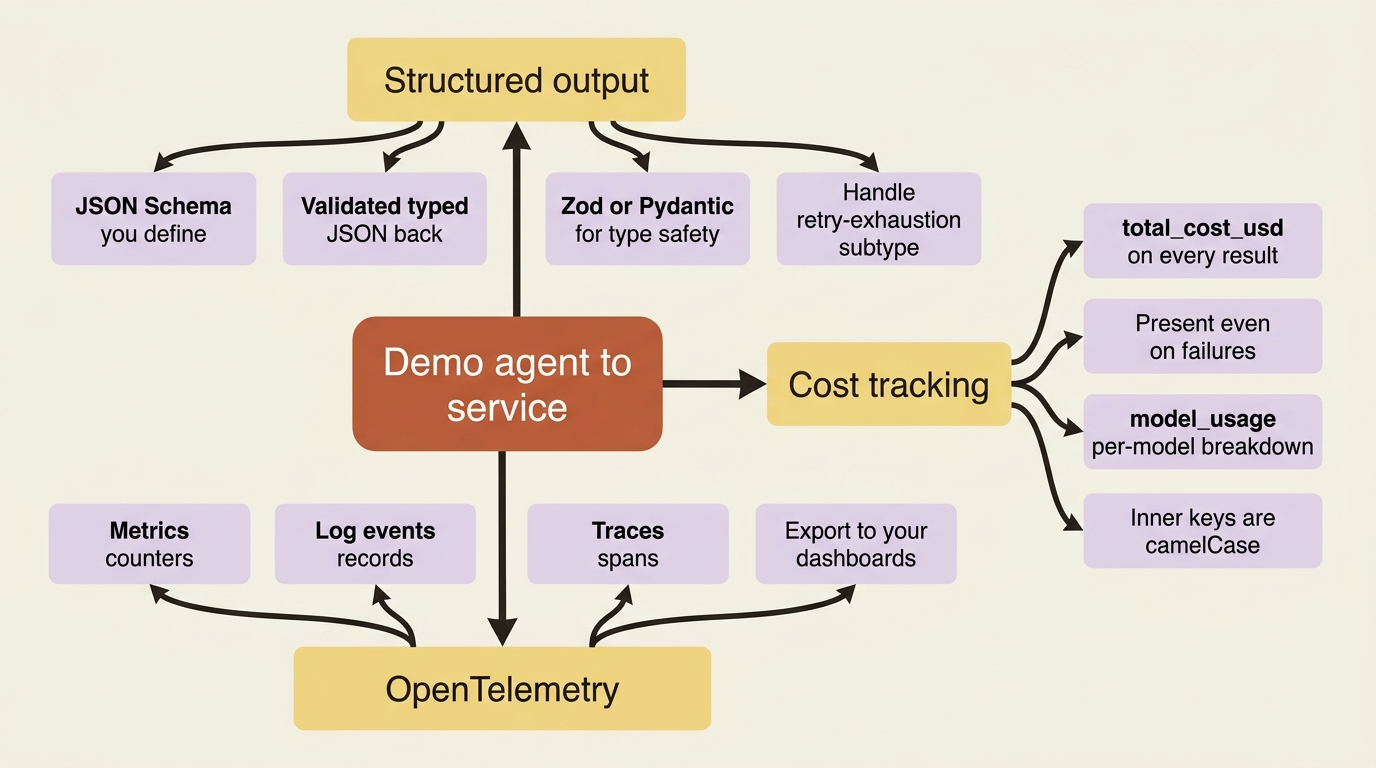
The three production capabilities that turn a Claude agent from a demo script into a service: typed structured output, per-run cost tracking, and OpenTelemetry traces.
A demo agent prints prose to a terminal. A production agent feeds a database, a UI, or the next service in a pipeline, and nobody is watching the terminal. Three capabilities close that gap.
In this article: You will learn the three capabilities that turn a Claude agent from a script that "worked when I tried it" into a service you can operate. Structured output gives downstream code typed JSON instead of paragraphs. Cost tracking puts a dollar figure on every run, including the failures. OpenTelemetry exports traces, metrics, and logs to the dashboards you already watch. By the end you will know how to wire all three, and which footguns to step around.
There is a quiet moment in every agent project where the thing finally works. You run it, it reads the right files, it fixes the bug, it prints a tidy summary, and you feel done. You are not done. You have a demo.
The difference between a demo and a service is not intelligence. It is operability. A demo agent prints prose to a terminal and a human reads it. A production agent runs headless inside a request handler or a cron job, hands its result to code that has never heard of "prose," and spends real money doing it. When it breaks at 3 a.m., nobody is watching the terminal because there is no terminal.
This article is about three capabilities that close that gap for the Claude Agent SDK: structured output, so downstream code receives typed data; cost tracking, so you know what every run spends; and OpenTelemetry, so a failure leaves a trace instead of a mystery. None of these change what the agent does. They change what you can do with it, which is the entire distance between a script and a service.
Structured Output: Stop Parsing Prose
By default, a Claude agent returns free-form text. That is exactly right for a chat window and exactly useless for code that needs a bug's file, line, and severity as actual fields. You can write a regex to scrape paragraphs, but that regex is a liability the first time the model phrases things differently.
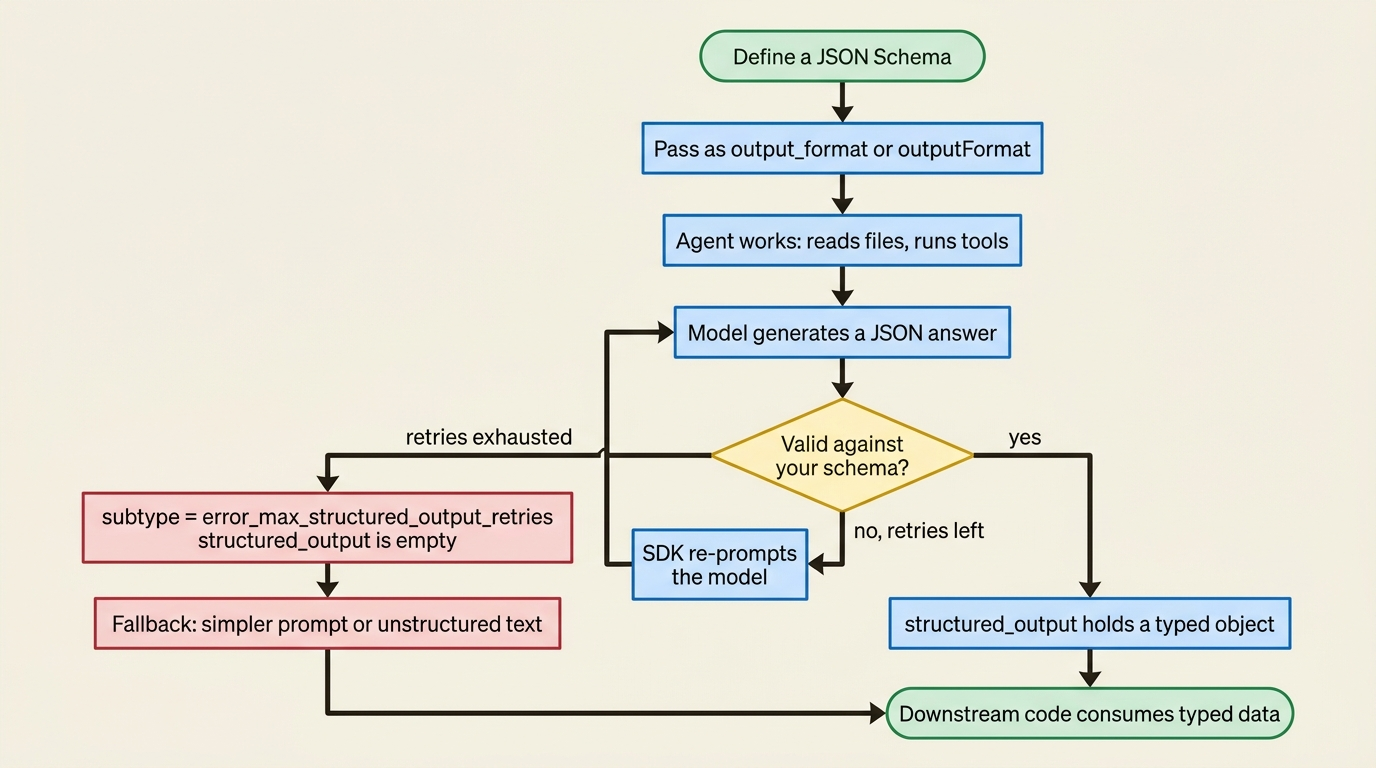
Structured output removes the parsing problem entirely. You define a JSON Schema describing the shape you want, pass it as output_format in Python or outputFormat in TypeScript, and the agent does its work (reading files, running commands, whatever the task needs), then hands back validated JSON at the end. The SDK validates the model's answer against your schema and re-prompts on a mismatch, so what arrives in your code already fits the contract.
Here is the running buggy-shop agent returning a structured diagnosis instead of a writeup.
import asyncio
from claude_agent_sdk import query, ClaudeAgentOptions, ResultMessage

schema = {
    "type": "object",
    "properties": {
        "bug_found": {"type": "boolean"},
        "file": {"type": "string"},
        "line": {"type": "number"},
        "severity": {"type": "string", "enum": ["low", "medium", "high"]},
        "summary": {"type": "string"},
    },
    "required": ["bug_found", "summary"],  # file/line optional: may not always be known  ①
}


async def main():
    async for message in query(
        prompt="Diagnose the failing test in buggy-shop's pricing module.",
        options=ClaudeAgentOptions(
            allowed_tools=["Read", "Bash", "Grep"],
            output_format={"type": "json_schema", "schema": schema},  # ②
        ),
    ):
        if isinstance(message, ResultMessage) and message.structured_output:  # ③
            bug = message.structured_output  # a dict matching the schema
            print(f"{bug['severity']} bug in {bug.get('file')}:{bug.get('line')}")


asyncio.run(main())
① Mark only the fields you truly need as required. Optional fields like file and line let the agent return partial results, and over-constrained schemas are the top reason generation fails.
② output_format hands the SDK your JSON Schema; the SDK validates the model's answer against it and re-prompts on a mismatch.
③ The validated object arrives as structured_output on the ResultMessage, already conforming to the schema.
Note: The full extracted listing at code/claude_agent_sdk/part-9-structured-output-cost-otel/listings/01-structured-output.py is the complete runnable program.
The same diagnosis in TypeScript: the contract is identical, with the result guarded by a discriminated-union check.
import { query } from "@anthropic-ai/claude-agent-sdk";

const schema = {
  type: "object",
  properties: {
    bug_found: { type: "boolean" },
    file: { type: "string" },
    line: { type: "number" },
    severity: { type: "string", enum: ["low", "medium", "high"] },
    summary: { type: "string" },
  },
  required: ["bug_found", "summary"], // file/line optional: may not always be known  ①
};

for await (const message of query({
  prompt: "Diagnose the failing test in buggy-shop's pricing module.",
  options: {
    allowedTools: ["Read", "Bash", "Grep"],
    outputFormat: { type: "json_schema", schema },  // ②
  },
})) {
  if (message.type === "result" && message.subtype === "success" && message.structured_output) {  // ③
    const bug = message.structured_output as any;  // ④
    console.log(`${bug.severity} bug in ${bug.file}:${bug.line}`);
  }
}
① Same design as the Python schema: require only bug_found and summary, leave the rest optional.
② In TypeScript the option is camelCase, outputFormat, the one naming difference from Python's output_format.
③ Guard on both subtype === "success" and structured_output before reading; an error subtype leaves the output empty.
④ The as any cast is a stopgap. Generate the schema from Zod to get a properly typed object instead.
Note: The full extracted listing at code/claude_agent_sdk/part-9-structured-output-cost-otel/listings/02-structured-output.ts is the complete runnable program.
The validated data lands in message.structured_output on the result. Look closely at the required array: it lists only bug_found and summary. That is deliberate. The agent cannot always pin a line number, so file and line are optional. This is the single most useful instinct for schema design: deeply nested schemas crammed with required fields are the most common reason generation fails. Require what you genuinely need and nothing more.
For real type safety, do not hand-write JSON Schema at all. Generate it from Zod in TypeScript or Pydantic in Python. You get editor autocomplete, runtime validation, and a properly typed object back through safeParse() or model_validate(), all of which beats indexing into a raw dictionary and hoping the key exists.
The Failure Mode You Have to Handle
Structured output can fail, and pretending otherwise is how you ship a crash. If the schema is too complex, the task too ambiguous, or the model exhausts its validation retries, the result comes back with subtype error_max_structured_output_retries, and structured_output is empty.
So check the subtype before you read the output, and keep a fallback ready: retry with a simpler prompt, or drop to plain unstructured text and parse it loosely. The one thing you must not do is assume the JSON is there.
One more property worth internalizing: structured output does not stream. The JSON only materializes at the very end, in the result message. A half-formed object midway through generation is not useful to anyone, so the SDK waits for the whole, valid thing before handing it over.
Cost Tracking: Read the Number Off the Result
Here is the good news about agent cost tracking: you do not have to build it. Every run's cost is already sitting on the result; you just have to read it.
The ResultMessage carries total_cost_usd, the estimated dollar cost of the whole run, alongside a usage object with token counts. The crucial detail is that these fields are present on every result, including the error subtypes. A run that failed still tells you what it spent. That matters more than it sounds: failures are not free, and an agent that retries its way into an expensive loop will not announce itself unless you are watching the failures too.
For per-model detail, the result also carries a model_usage dictionary. It maps each model the run touched to its own usage breakdown: input tokens, output tokens, cache creation and cache read tokens, web-search request counts, and a client-side cost estimate. This is where you would discover that your cheap reviewer subagent on Sonnet cost a fraction of the main Opus agent, exactly the kind of insight that informs whether your architecture is economical.
async for message in query(prompt="Fix the bug in buggy-shop.", options=options):
    if isinstance(message, ResultMessage):
        # total_cost_usd is present on success AND error subtypes
        if message.total_cost_usd is not None:  # ①
            print(f"Run cost: ${message.total_cost_usd:.4f}")

        # Per-model breakdown; inner keys are camelCase (passed through from the CLI)
        for model, usage in (message.model_usage or {}).items():  # ②
            print(f"  {model}: {usage['inputTokens']} in / {usage['outputTokens']} out "
                  f"= ${usage['costUSD']:.4f}")
① total_cost_usd is on every result, including error subtypes, so guarding for None captures spend even on failed runs.
② model_usage breaks the cost down per model; note the inner keys (inputTokens, costUSD) are camelCase even in Python.
The Naming Trap That Will Bite You
The field naming here is genuinely inconsistent, and it is the kind of bug that survives code review because the code looks right.
The top-level fields are snake_case: total_cost_usd. But the inner keys of model_usage are camelCase, namely inputTokens and costUSD, even in Python. They are camelCase because that dictionary is passed through unmodified from the underlying Claude Code CLI, which is a JavaScript program. Reach for usage["input_tokens"] inside model_usage in a Python codebase and you will earn a KeyError. It is usage["inputTokens"].
And remember that total_cost_usd is typed optional. It can be None on some error paths, so guard before you format it, or your cost logging will be the thing that crashes.
OpenTelemetry: Traces for When the Terminal Is Gone
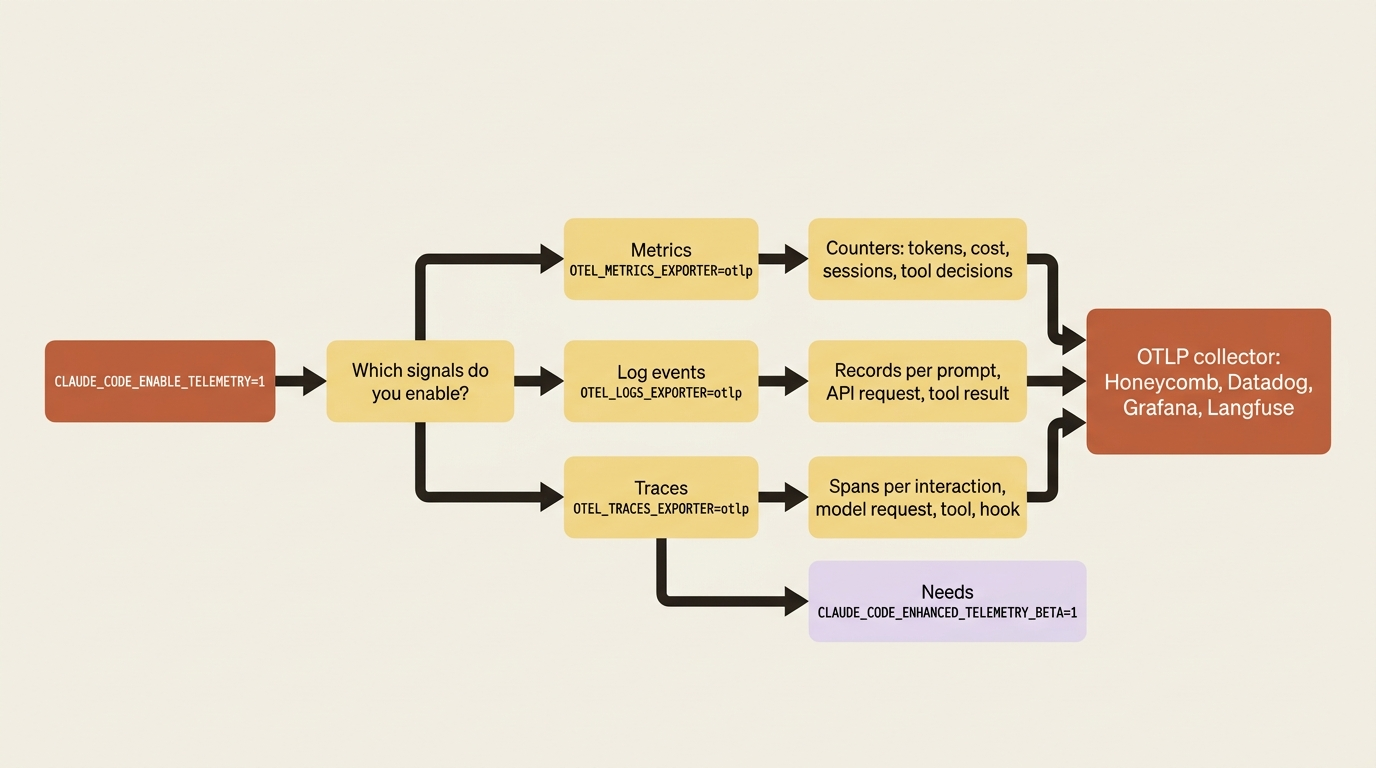
Reading cost off the result works beautifully when you are holding the result. In production you frequently are not. The agent runs headless inside a service, and the data you want lives in Honeycomb, Datadog, Grafana, or Langfuse: the dashboards your team already watches when something is on fire.
That is what OpenTelemetry is for. The interesting architectural detail is that the SDK does not emit telemetry itself. It runs the Claude Code CLI as a child process, and the CLI has OTel instrumentation built in. You pass configuration through as environment variables, and the CLI exports straight to your collector over OTLP. You are not instrumenting your agent; you are switching on instrumentation that already exists.
There are three independent signals, each with its own switch, so you turn on only what you need:
- Metrics are counters: tokens, cost, sessions, and tool decisions.
- Log events are structured records, one for each prompt, API request, and tool result.
- Traces are spans for each interaction, model request, tool call, and hook. They are the most detailed view, and the one you will reach for when debugging.
All of it stays dark until you set CLAUDE_CODE_ENABLE_TELEMETRY=1 and choose at least one exporter.
import asyncio
from claude_agent_sdk import query, ClaudeAgentOptions

OTEL_ENV = {
    "CLAUDE_CODE_ENABLE_TELEMETRY": "1",  # ①
    "CLAUDE_CODE_ENHANCED_TELEMETRY_BETA": "1",   # required for traces (beta); metrics/logs don't need it  ②
    "OTEL_TRACES_EXPORTER": "otlp",
    "OTEL_METRICS_EXPORTER": "otlp",
    "OTEL_LOGS_EXPORTER": "otlp",
    "OTEL_EXPORTER_OTLP_PROTOCOL": "http/protobuf",
    "OTEL_EXPORTER_OTLP_ENDPOINT": "http://collector.example.com:4318",  # ③
    "OTEL_EXPORTER_OTLP_HEADERS": "Authorization=Bearer your-token",
}


async def main():
    # In Python, env merges on top of the inherited environment
    options = ClaudeAgentOptions(env=OTEL_ENV)  # ④
    async for message in query(prompt="Fix the bug in buggy-shop.", options=options):
        print(message)


asyncio.run(main())
① Telemetry stays off until this master switch is set; nothing exports without it.
② The enhanced-telemetry beta flag is required specifically for traces; metrics and logs work without it.
③ Point the OTLP endpoint at your collector; the CLI exports straight there over OTLP.
④ In Python the env option merges on top of the inherited environment, so you only add the OTel keys.
Note: The full extracted listing at code/claude_agent_sdk/part-9-structured-output-cost-otel/listings/03-otel-telemetry.py is the complete runnable program.
The same configuration in TypeScript differs on one line that matters more than it looks:
import { query } from "@anthropic-ai/claude-agent-sdk";

const otelEnv = {
  CLAUDE_CODE_ENABLE_TELEMETRY: "1",  // ①
  CLAUDE_CODE_ENHANCED_TELEMETRY_BETA: "1", // required for traces (beta)
  OTEL_TRACES_EXPORTER: "otlp",
  OTEL_METRICS_EXPORTER: "otlp",
  OTEL_LOGS_EXPORTER: "otlp",
  OTEL_EXPORTER_OTLP_PROTOCOL: "http/protobuf",
  OTEL_EXPORTER_OTLP_ENDPOINT: "http://collector.example.com:4318",  // ②
  OTEL_EXPORTER_OTLP_HEADERS: "Authorization=Bearer your-token",
};

for await (const message of query({
  prompt: "Fix the bug in buggy-shop.",
  // In TypeScript, env REPLACES the inherited environment, so spread process.env first
  options: { env: { ...process.env, ...otelEnv } },  // ③
})) {
  console.log(message);
}
① The master telemetry switch, identical to the Python version.
② The OTLP endpoint your collector listens on.
③ In TypeScript env replaces the inherited environment, so you must spread ...process.env first or the child process loses PATH and your API key.
Note: The full extracted listing at code/claude_agent_sdk/part-9-structured-output-cost-otel/listings/04-otel-telemetry.ts is the complete runnable program.
The env Footgun Hiding in Plain Sight
Those two snippets differ on exactly one line, and that line is the trap.
In Python, the env option merges on top of your inherited environment. In TypeScript, env replaces it entirely. If you do not spread ...process.env into the TypeScript object first, you erase PATH, your API key, and everything else the child process needs to function. The symptom is not a clear error message; it is an agent that simply will not start, and a confused half-hour spent looking everywhere except the one line that caused it.
A second OpenTelemetry footgun: do not set console as an exporter when running through the SDK. The SDK uses standard output as its message channel, and a console exporter would corrupt that stream. To eyeball telemetry locally, point the OTLP endpoint at a local collector or an all-in-one Jaeger container instead.
Traces Nest Under Your App, and Short Runs Need a Flush
Two details separate traces that are merely present from traces that are genuinely useful.
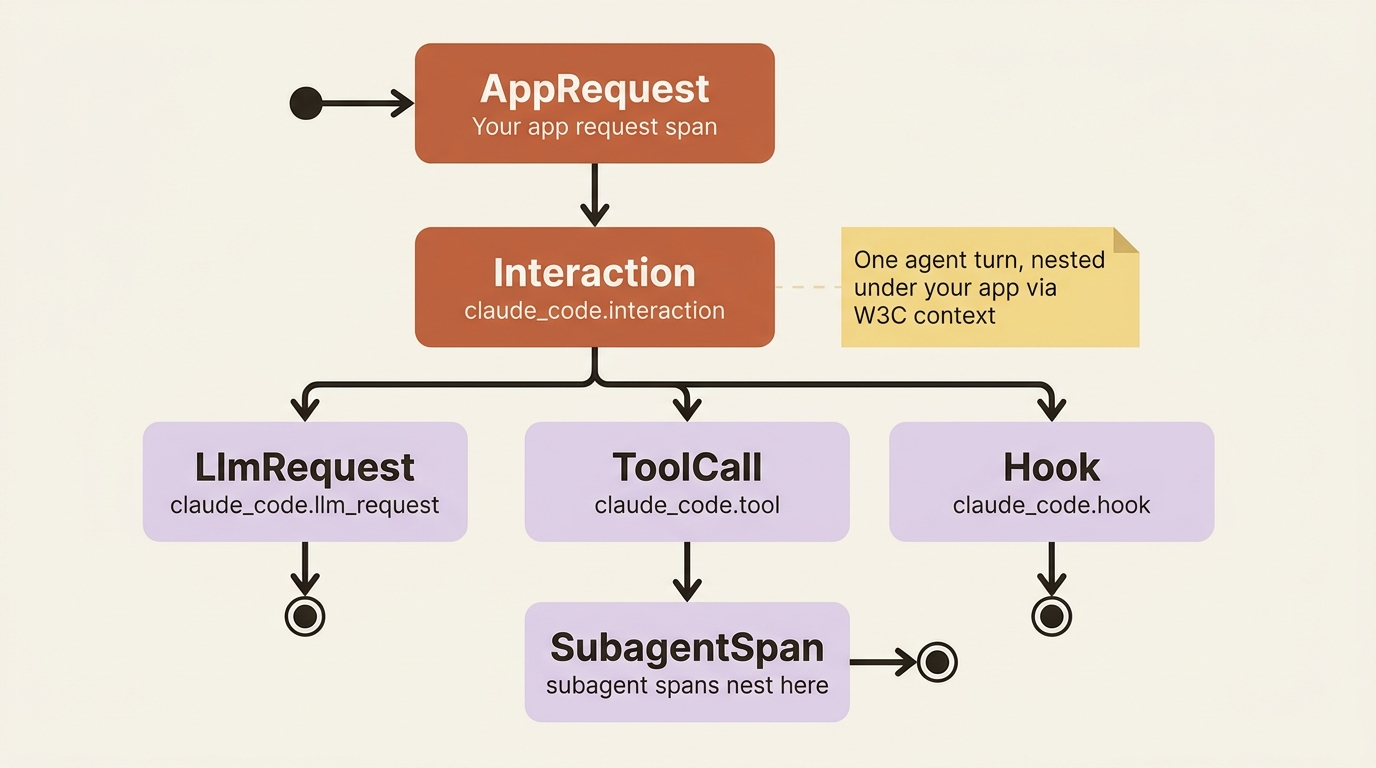
First, trace context propagation. The SDK automatically passes W3C trace context into the CLI subprocess, so the agent's spans nest under your application's existing spans. An agent run shows up as part of the HTTP request that triggered it, not as an orphaned trace floating alone in your backend. The hierarchy reads cleanly too: claude_code.interaction wraps a turn, with claude_code.llm_request, claude_code.tool, and claude_code.hook spans nested inside. A subagent's spans nest under the parent's tool span, so an entire delegation chain shows up as one coherent trace you can read top to bottom. One caveat: claude_code.hook spans require detailed beta tracing, which means extra flags (ENABLE_BETA_TRACING_DETAILED=1 and BETA_TRACING_ENDPOINT) beyond CLAUDE_CODE_ENHANCED_TELEMETRY_BETA.
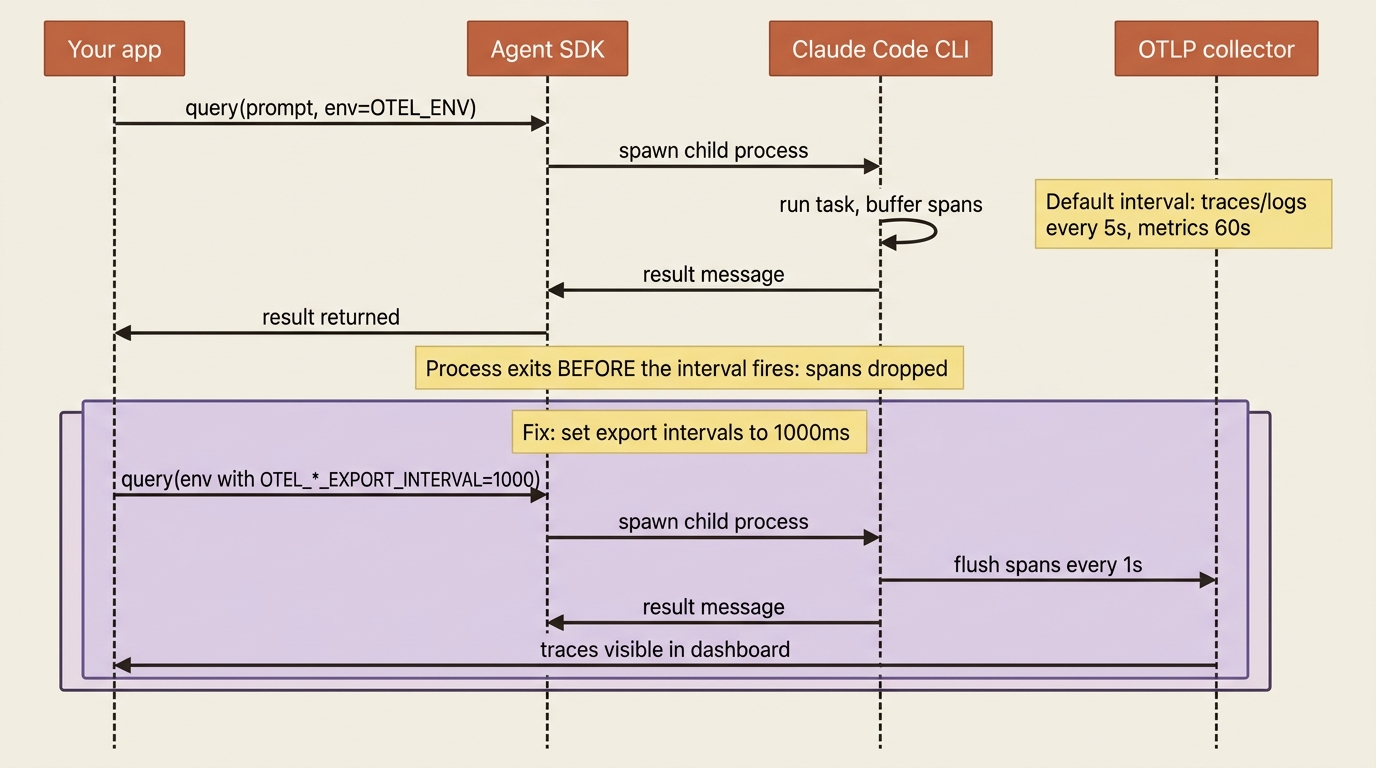
Second, the flush problem. The CLI batches telemetry and exports it on an interval: metrics every 60 seconds, traces and logs every 5. A short buggy-shop task can finish, and the process can exit, before that interval ever fires, dropping the very spans you wanted most. The fix is to shorten the export intervals so data reaches the collector while the task is still alive:
OTEL_ENV = {
    # ... the exporter config above ...
    "OTEL_METRIC_EXPORT_INTERVAL": "1000",   # 1s instead of 60s
    "OTEL_LOGS_EXPORT_INTERVAL": "1000",
    "OTEL_TRACES_EXPORT_INTERVAL": "1000",
}
One last thing worth knowing before you ship this. By default, spans record durations, model names, and tool names, but not the content the agent reads and writes. If you want prompt text or tool inputs in your traces, you opt in explicitly:
OTEL_LOG_USER_PROMPTS=1adds the prompt text.OTEL_LOG_TOOL_DETAILS=1adds tool arguments such as file paths and commands.OTEL_LOG_TOOL_CONTENT=1adds full tool input and output bodies, truncated at 60 KB, and requires tracing to be on.
These are off by default for a real reason: they put potentially sensitive content into your observability backend. Enable them deliberately, and with your data-handling rules clearly in mind.
Do This Today
Pick the agent you run most often and make it operable in one sitting:
- Add a JSON Schema to one query. Start with a flat schema and require only the fields you genuinely cannot proceed without. Read the result from
message.structured_output. - Handle the failure path. Add an explicit check for the
error_max_structured_output_retriessubtype, and write a fallback before you need it. - Log the cost of every run. Read
total_cost_usdoff theResultMessage, guard forNone, and remember themodel_usageinner keys are camelCase even in Python. - Stand up a local Jaeger container and point
OTEL_EXPORTER_OTLP_ENDPOINTat it. Set the three export intervals to1000so short runs actually report. - In TypeScript, audit every
envyou pass and confirm you spread...process.envfirst.
The Takeaway
Shipping an agent is not a matter of making it smarter. It is a matter of making its output consumable, its cost visible, and its behavior inspectable.
Structured output hands downstream code typed JSON validated against your schema, as long as you keep that schema focused and handle the retry-exhaustion subtype. Cost tracking is already sitting on the result message, present even on the failures, with the single trap that model_usage's inner keys are camelCase. OpenTelemetry exports traces, metrics, and logs straight to the backends you already run, with W3C context nesting agent runs under your app's spans, the interval-flush trick rescuing short runs, and content logging strictly opt-in.
Mind the env merge-versus-replace difference between the two SDKs, and you will have telemetry flowing without breaking the agent.
The agent is now observable, and its output is production-ready. There is exactly one frontier left: getting it off your laptop safely. The next concern is deployment: the long-running-process architecture, ephemeral versus persistent sessions, and the sandboxing and hardening that keep an agent acting on untrusted input from becoming a liability.
This is Part 9 of "Building with the Claude Agent SDK," a 14-part guide to building production-ready AI agents.