
It Worked When You Watched. Observability Is How You Know It Works When You Do Not.
OpenTelemetry tracing shows what an agent did; the evaluation framework proves whether what it did was actually good. Wire both onto the same running agent and you have replaced 'it worked when I watched' with a repeatable answer.
Microsoft Agent Framework ships OpenTelemetry tracing and an evaluation framework for free. Here is how the spans, metrics, and evaluators turn a demo you watched into a system you can trust unattended.
An agent that worked once in your terminal is not proof it works unattended. This is how you get proof instead of a screenshot.
In this article: you will wire OpenTelemetry tracing onto a Microsoft Agent Framework agent, learn the three GenAI spans and three metrics every instrumented run produces, point those traces at a real destination (Aspire Dashboard, Azure Monitor, or standard OTLP), and then build local evaluators, including a custom one, that answer a repeatable question about an agent's output instead of a one-off glance at whatever example happened to be on screen.
You have watched an agent research a topic, write a report, and ask before it spends money. Every one of those observations happened because you were staring at a terminal while it ran. The moment nobody is watching, an agent's behavior is only as knowable as the telemetry it emits, and its quality is only as verifiable as the checks you run against its output.
Microsoft Agent Framework ships answers to both problems: OpenTelemetry tracing, so a run leaves invoke_agent, chat, and execute_tool spans behind it, and an evaluation framework, so you can ask a specific, repeatable question about the output instead of eyeballing one example and hoping it generalizes. This article covers both, using a running market-research agent as the example: a harness-based agent that plans before it researches, remembers prior findings, and asks approval before it writes a file or calls a paid API.
The harness already turned tracing on. You still have to point it somewhere
Microsoft Agent Framework's agent harness bundles OpenTelemetry as one of its default capabilities, following the OpenTelemetry GenAI semantic conventions. That default matters for a plain ChatClientAgent or Agent too, but there it is opt-in: you wrap the chat client and the agent explicitly. In C#, that looks like this:
var instrumentedChatClient = chatClient
    .AsBuilder()
    .UseOpenTelemetry(sourceName: "MarketResearch", configure: cfg => cfg.EnableSensitiveData = false)  // ①
    .Build();

var agent = new ChatClientAgent(
    instrumentedChatClient,
    name: "MarketResearcher",
    instructions: "You are a market research analyst who gives clear, concise answers."
).WithOpenTelemetry(sourceName: "MarketResearch", configure: cfg => cfg.EnableSensitiveData = false);  // ②
① UseOpenTelemetry instruments the chat client itself, the layer that talks directly to the
model.
② WithOpenTelemetry instruments the agent's own run, wrapping the chat client's calls inside an
invoke_agent span.
Note: The full extracted listing at
code/microsoft_agent_framework/part-10-observability-and-evaluation/listings/01-instrumented-agent.cs
shows the surrounding context, the chatClient this snippet builds on.
Wrapping both means the chat context, including prompts and responses when sensitive data is on, shows up in both spans, so most teams pick one layer to instrument rather than both.
Python skips the per-object wrapping entirely. Observability there is a process-wide switch: call configure_otel_providers() once, and every instrumented chat client and agent in the process starts emitting spans through the same tracer.
from agent_framework.observability import configure_otel_providers

# Reads OTEL_EXPORTER_OTLP_* and ENABLE_* environment variables automatically
configure_otel_providers()
That difference in shape, C# opts in per client and per agent, Python opts in once for the whole process, is worth knowing before you go looking for a WithOpenTelemetry-equivalent method on the Python Agent class. There is not one. There is an environment variable and a function call.
Because a harness agent is already instrumented, none of the wrapping above is your job for it. The harness's disable_open_telemetry / DisableOpenTelemetry flag defaults to false, so instrumentation is already active the moment you construct the agent. Your job is narrower: make sure something is actually configured to receive what the harness is already emitting.
The three spans every run produces
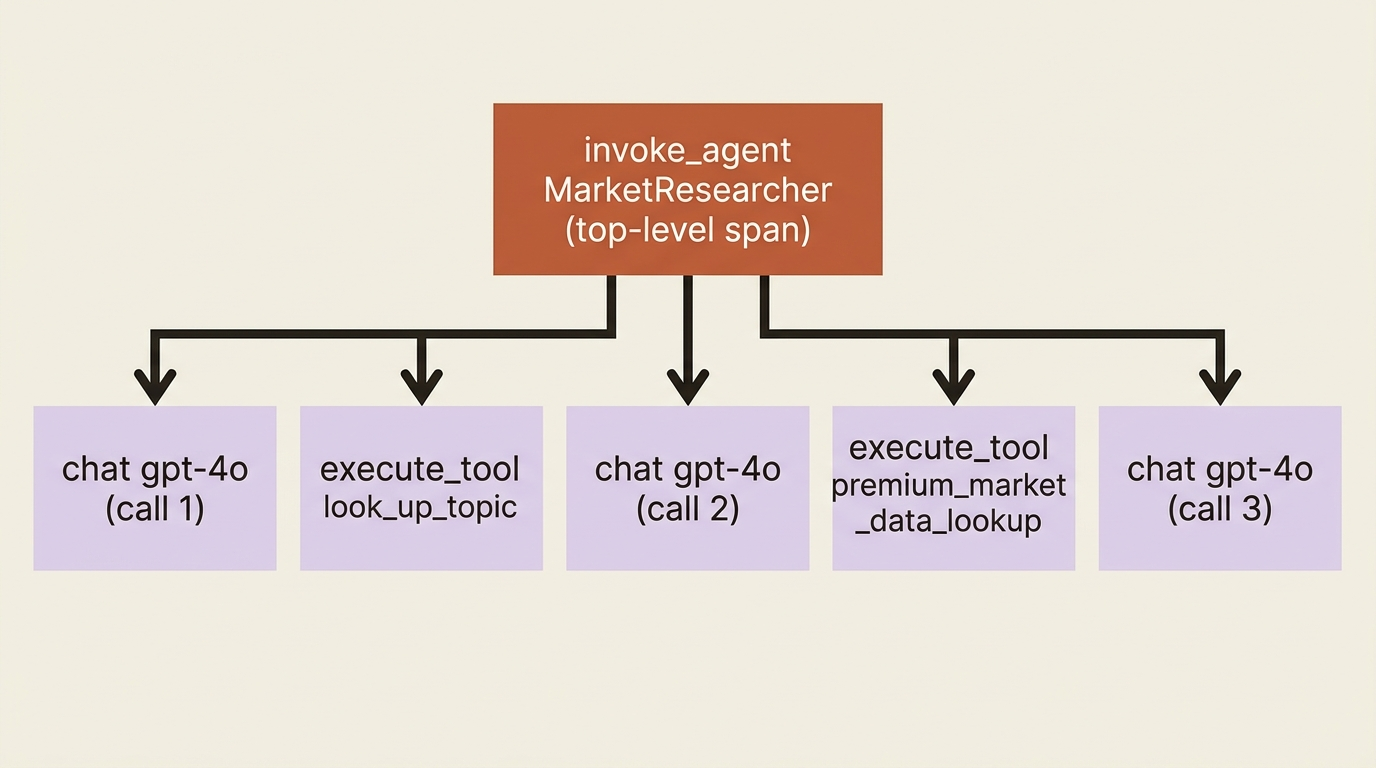
Once a chat client or agent is instrumented, and something is listening, three spans show up for a typical tool-calling run:
| Span | When it is created | What it contains |
|---|---|---|
invoke_agent <agent_name> |
Once per agent invocation, the top-level span | Every other span as a child; agent ID, name, and instructions |
chat <model_name> |
Once per call to the underlying model | Prompt and response as attributes, when sensitive data is enabled |
execute_tool <function_name> |
Once per function tool call | Function arguments and result, when sensitive data is enabled |
In prose: invoke_agent <agent_name> is the top-level span for one agent invocation, and every other span nests inside it as a child, alongside the agent's ID, name, and instructions. chat <model_name> fires for each call to the underlying model and carries the prompt and response as attributes when sensitive data is enabled. execute_tool <function_name> fires for each function tool call and carries the function's arguments and result, gated behind that same sensitive-data flag.
Alongside the spans, three metrics accumulate automatically: gen_ai.client.operation.duration, a histogram of how long each model call takes; gen_ai.client.token.usage, a histogram of tokens consumed; and agent_framework.function.invocation.duration, a histogram of how long each tool call takes to execute. Watch that last one on a tool-heavy agent specifically. When one tool calls a web search and another calls a paid API, a duration histogram is the fastest way to notice one of them has started timing out before a user complains about a slow session.
Sensitive data is opt-in, and it earns that caution
Every attribute that would actually let you read a prompt, a response, a tool's arguments, or a tool's result sits behind one flag: ENABLE_SENSITIVE_DATA in Python, EnableSensitiveData in the C# configuration callback. It defaults to off. Turn it on in development, where you need to see what the model actually said to debug a bad output, and leave it off everywhere else.
Gotcha: a harness agent's OpenTelemetry capability being "on" only means the framework is emitting spans into whatever tracer provider is configured for the process. If you never call configure_otel_providers(), never set the OTEL_EXPORTER_OTLP_ENDPOINT environment variable, and never wire up a tracer provider in C#, those spans have nowhere to go and disappear silently. disable_open_telemetry controls whether the harness instruments its own calls, not whether anything is listening. Confirm you have an exporter configured before you trust that a trace exists.
Where the traces actually go
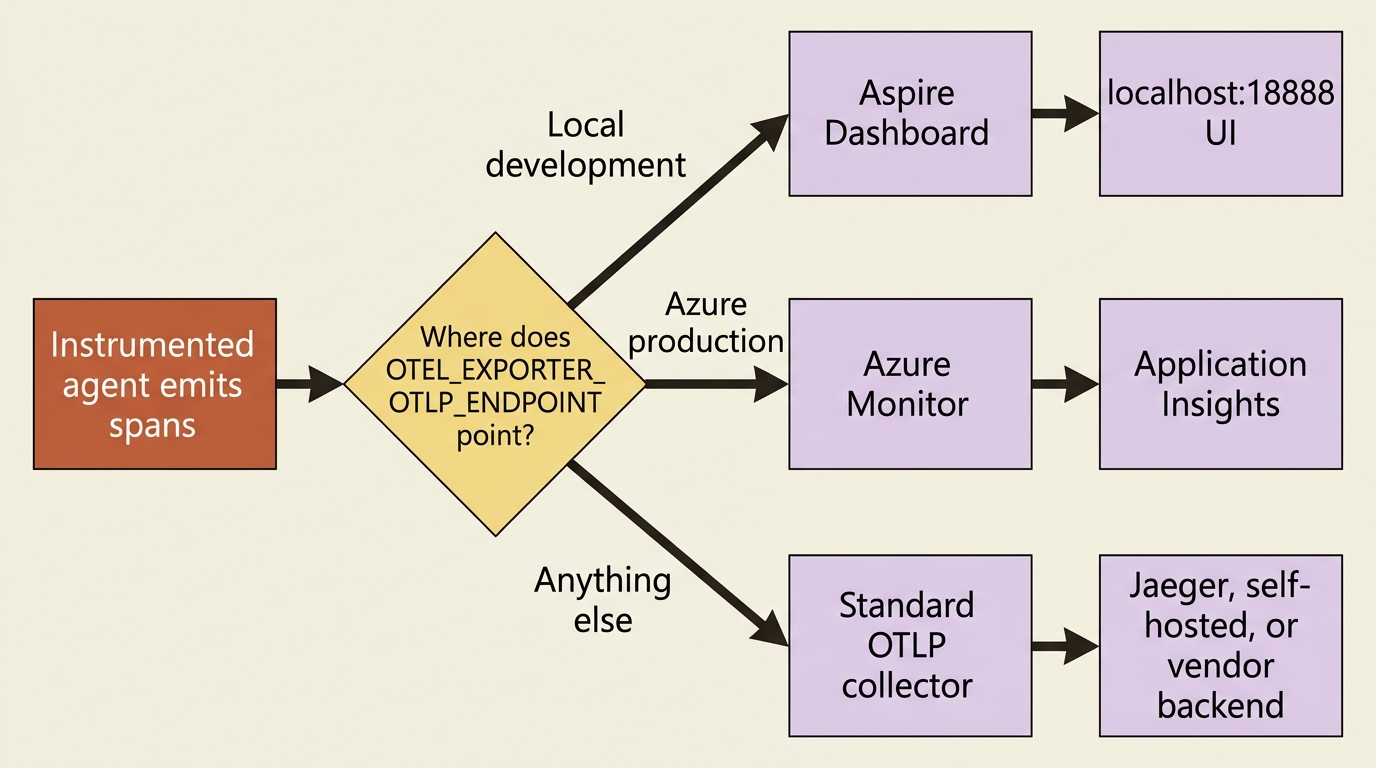
The GenAI spans and metrics are only useful once they land somewhere you can look at them. Three destinations cover most of what you will reach for:
| Destination | Best for | How you point at it |
|---|---|---|
| Aspire Dashboard | Local development, a fast way to see traces without any cloud setup | Run the dashboard container, set OTEL_EXPORTER_OTLP_ENDPOINT to its port |
| Azure Monitor | Production, when you are already on Azure and want traces, metrics, and logs in Application Insights | Configure the Azure Monitor exporter with your connection string |
| Standard OTLP | Any other backend: Jaeger, a self-hosted collector, or a third-party observability vendor | Set the standard OTEL_EXPORTER_OTLP_* environment variables and let configure_otel_providers() read them |
In prose:
- Aspire Dashboard: best for local development, a fast way to see traces without any cloud setup. Run the dashboard container and set
OTEL_EXPORTER_OTLP_ENDPOINTto its port. - Azure Monitor: best for production, when you are already on Azure and want traces, metrics, and logs in Application Insights. Configure the Azure Monitor exporter with your connection string.
- Standard OTLP: best for any other backend, Jaeger, a self-hosted collector, or a third-party observability vendor. Set the standard
OTEL_EXPORTER_OTLP_*environment variables and letconfigure_otel_providers()read them.
For local development, the Aspire Dashboard is the least ceremony of the three. Pull and run it, then point your process at it:
docker run --rm -it -d \
    -p 18888:18888 \
    -p 4317:18889 \
    --name aspire-dashboard \
    mcr.microsoft.com/dotnet/aspire-dashboard:latest
ENABLE_INSTRUMENTATION=true
OTEL_EXPORTER_OTLP_ENDPOINT=http://localhost:4317
Open http://localhost:18888 after a run and you are looking at the same invoke_agent, chat, and execute_tool spans the agent just produced, with parent-child nesting and timing already laid out for you.
In production: swap the Aspire Dashboard for Azure Monitor or a standard OTLP collector, not for nothing. configure_otel_providers() and the AddOtlpExporter / AddAzureMonitorTraceExporter calls on the C# side are additive: you can point at Aspire locally and at Azure Monitor in a deployed environment using the same instrumentation code, changing only which environment variables or exporter configuration you supply per environment.
Wiring tracing onto a harness agent
Because the harness instruments itself, wiring tracing onto an existing harness agent is mostly a matter of calling configure_otel_providers() before you build it, not touching the constructor at all:
from agent_framework.observability import configure_otel_providers
from agent_framework.openai import OpenAIChatClient

configure_otel_providers()  # reads OTEL_EXPORTER_OTLP_* and ENABLE_* env vars  ①

agent = create_harness_agent(
    client=OpenAIChatClient(),
    name="MarketResearcher",
    harness_instructions="Plan before researching. Track subtopics as todos. "
                          "Never skip approval for a write, a paid lookup, or a script run.",
    agent_instructions="You are a market research analyst who gives clear, concise answers.",
    tools=[look_up_topic, write_report_file, premium_market_data_lookup],  # ②
    context_providers=[
        ResearchMemoryProvider("quantum computing funding trends", findings_store),
        market_research_skills,
    ],  # ③
    max_context_window_tokens=128_000,
    max_output_tokens=16_384,
    disable_tool_auto_approval=True,  # ④
)
① configure_otel_providers() runs once, before the agent is built, and is the only line this
adds on top of an already-built harness agent; every instrumented chat client and agent in the
process now shares its tracer.
② Each tool gets its own execute_tool span the moment tracing is on.
③ A memory provider and any on-demand skills show up as nested spans under invoke_agent the
moment a run touches them.
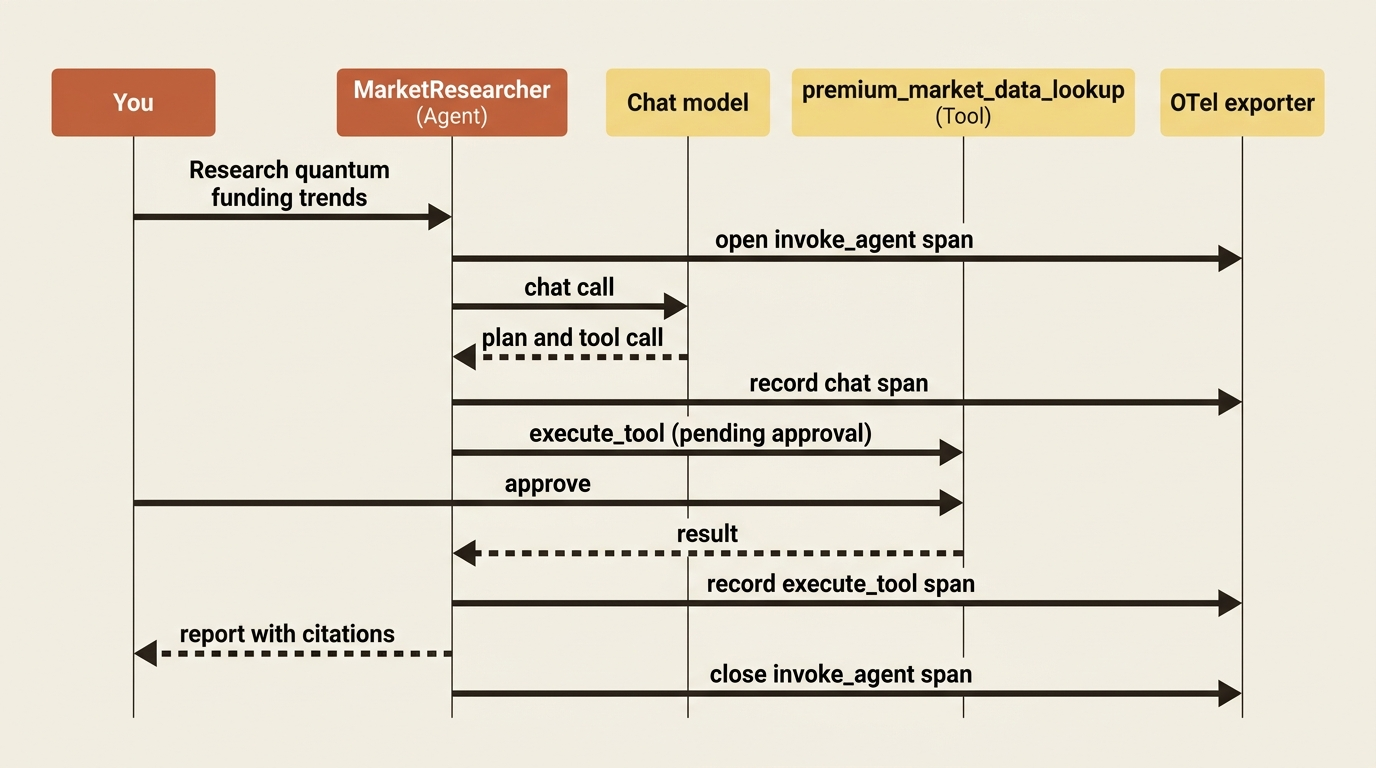
④ Turning off auto-approval keeps an approval-gated execute_tool span pending until you confirm
it, exactly the call this instrumentation now captures.
Note: The full extracted listing at code/microsoft_agent_framework/part-10-observability-and-evaluation/listings/02-wire-tracing-market-research-agent.py shows this call in context, with the tool and skill references it depends on.
Nothing about that constructor call changes. What changes is that a single line before it now means every plan, every todo update, every skill load, and every approval-gated tool call this agent makes leaves a span behind. Run a research session and the trace tells a story you would otherwise have to reconstruct from memory: invoke_agent MarketResearcher as the outer span, load_skill and read_skill_resource calls nested inside it, execute_tool premium_market_data_lookup sitting there pending until you approve it, and a chat span for every model call the plan-and-execute loop made along the way.
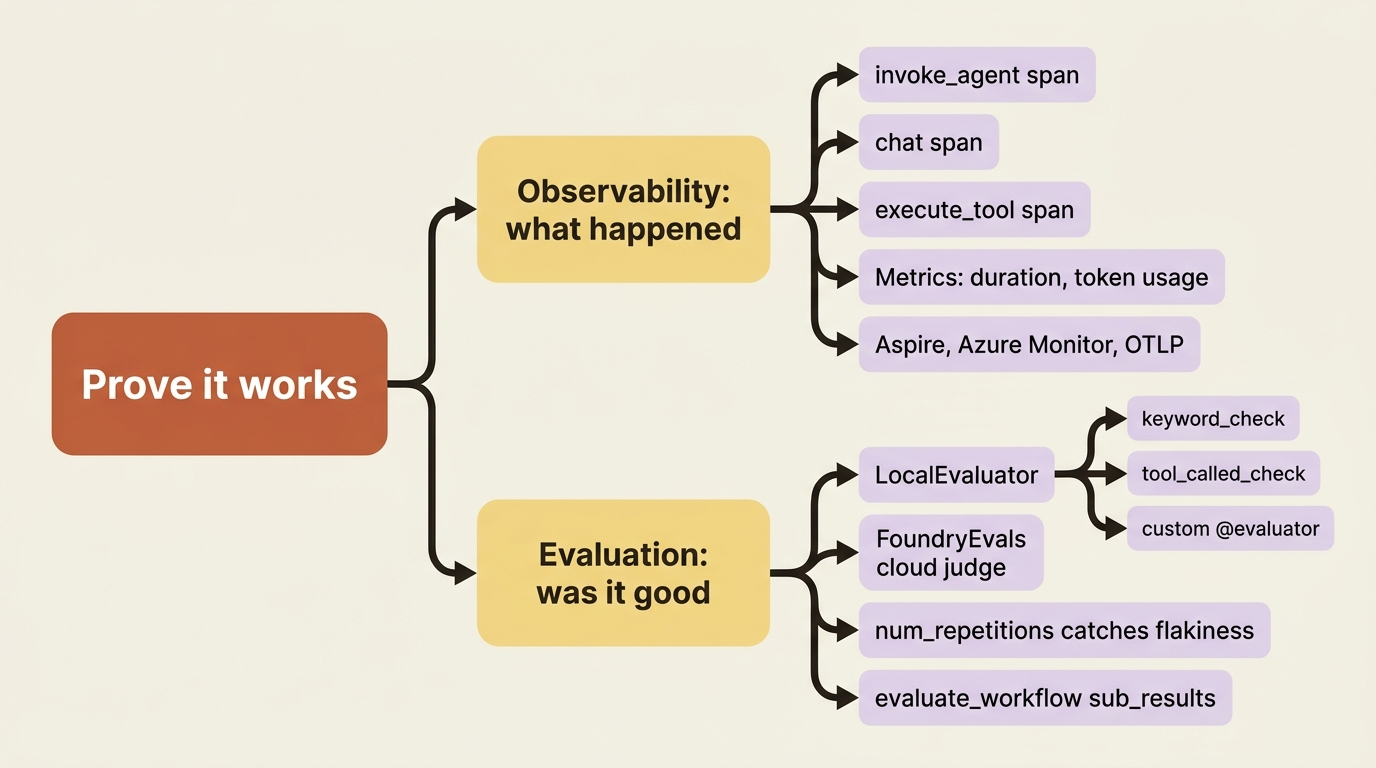
Observability tells you what happened. Evaluation tells you if it was good
A trace is a record, not a verdict. It will faithfully show you that an agent called write_report_file with a 400-word report that never once cites a source, and it will not flag that as a problem, because nothing about a span asks whether the output was any good.
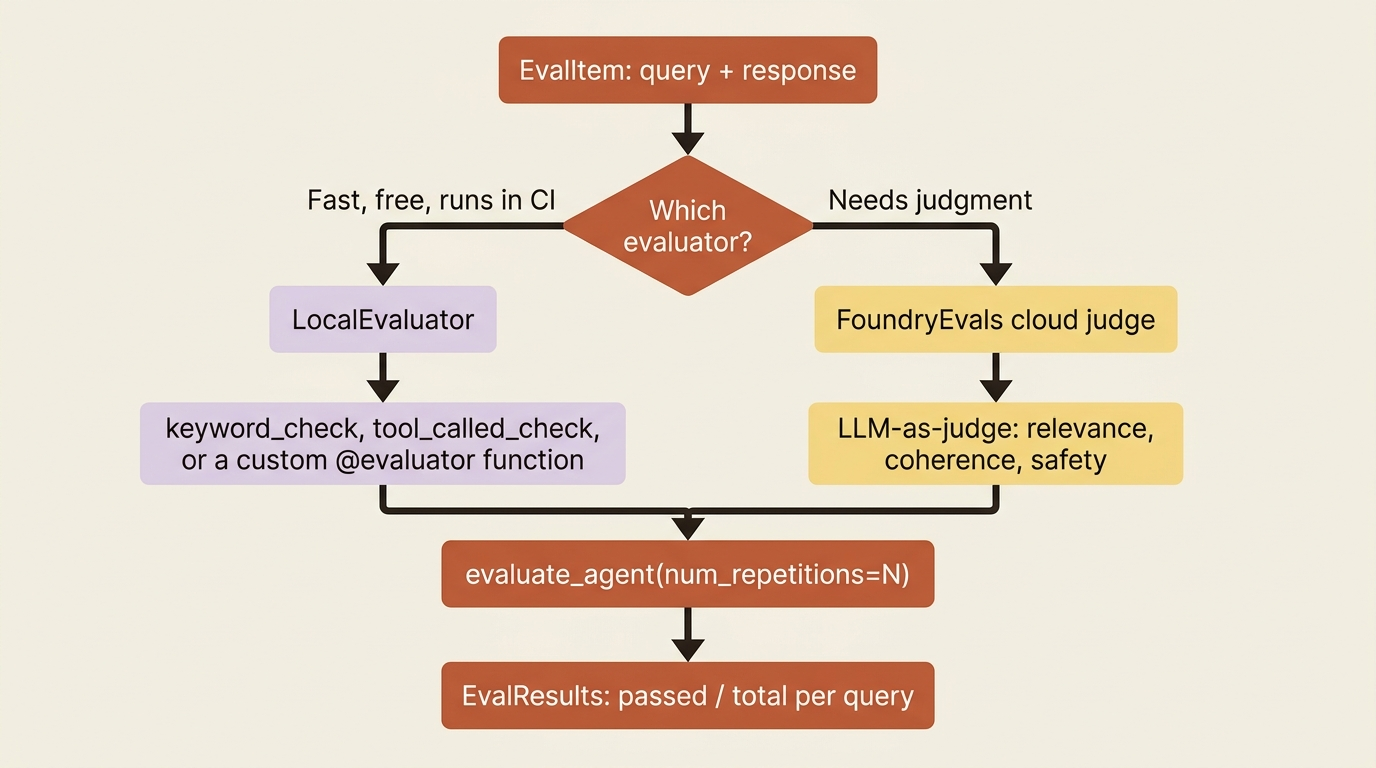
That is the job evaluation does instead. Agent Framework's evaluation framework is built on three types: an EvalItem, which wraps a full conversation and derives the query and response from it; an Evaluator, a provider that scores items, whether that is a fast local check or a cloud-based LLM judge; and EvalResults, the aggregated pass and fail counts an evaluation run produces.
Local evaluators score fast, for free
LocalEvaluator runs checks without an API call, which makes it the right tool for CI and for the kind of fast iteration where waiting on a cloud evaluator would slow you down. It ships with built-in checks for the common cases:
| Check | What it does |
|---|---|
keyword_check(*keywords) |
Response must contain all specified keywords |
tool_called_check(*tool_names) |
Agent must have called the specified tools |
tool_calls_present |
Every expected tool call name appears in the conversation, unordered, extras allowed |
tool_call_args_match |
Expected tool calls match on name and arguments, subset match on arguments |
In prose:
keyword_check(*keywords): the response must contain every keyword you list.tool_called_check(*tool_names): the agent must have called every tool you name.tool_calls_present: every expected tool call's name must appear somewhere in the conversation, in any order, extra calls allowed.tool_call_args_match: expected tool calls must match on both name and arguments, using a subset match on the arguments.
For anything the built-ins do not cover, the @evaluator decorator wraps a plain function into a check. The function's parameter names tell the framework which pieces of the EvalItem to hand it, drawn from query, response, expected_output, expected_tool_calls, conversation, tools, and context:
from agent_framework import evaluator, LocalEvaluator

@evaluator
def is_concise(response: str) -> bool:
    """Check response is under 500 words."""
    return len(response.split()) < 500

local = LocalEvaluator(is_concise, keyword_check("funding", "quantum"))
A bool return means pass or fail directly; a float passes at 0.5 or above, which is how you would score something more graded than a yes-or-no check. For LLM-as-judge scoring against relevance, coherence, or safety, FoundryEvals connects the same EvalItem and EvalResults types to Azure AI Foundry's cloud evaluation service, worth knowing about the moment a local keyword check stops being precise enough.
Repetitions catch what a single run hides
An agent that calls a model is not deterministic, and a single passing run tells you nothing about whether that pass was luck. evaluate_agent takes a num_repetitions argument that runs each query several times independently and reports every result:
from agent_framework import evaluate_agent

results = await evaluate_agent(
    agent=agent,
    queries=["Summarize what you've found on quantum computing funding trends."],
    evaluators=local,
    num_repetitions=3,  # each query runs 3 times independently
)
for r in results:
    print(f"{r.provider}: {r.passed}/{r.total}")
Three passes out of three on a keyword check is a much stronger claim than one pass out of one, and a check that fails once in three runs is exactly the kind of flakiness that never shows up if you only ever run a query a single time before shipping.
An evaluator that checks the report cites its sources
A research skill can ship a citation-checking script an agent runs against its own draft mid-task, gated behind approval like every other script run. That is the agent checking itself, one report at a time, while it is still working. What you want now is the opposite direction: an offline check you run against the agent's output after the fact, across many queries, that does not depend on the agent remembering to invoke its own skill correctly. A custom evaluator does that job:
from agent_framework import evaluator, LocalEvaluator, evaluate_agent

@evaluator
def cites_sources(response: str) -> bool:
    """The final report must include a Sources section with at least one link."""
    return "## Sources" in response and ("http://" in response or "https://" in response)  # ①

report_evaluator = LocalEvaluator(cites_sources, keyword_check("Executive Summary"))  # ②

results = await evaluate_agent(
    agent=agent,
    queries=[
        "Research quantum computing funding trends and write the report.",
        "Research AI chip export policy and write the report.",
    ],  # ③
    evaluators=report_evaluator,
    num_repetitions=2,  # ④
)
for r in results:
    print(f"{r.provider}: {r.passed}/{r.total}")
    r.raise_for_status()  # raises EvalNotPassedError if any item failed  ⑤
① The check itself is a plain boolean, true only when a ## Sources heading and an actual link
both appear in the report.
② Combining cites_sources with the built-in keyword_check runs a custom rule and a shipped
rule as one evaluator.
③ Listing more than one query is what makes this an offline check across topics, not a read of
one report.
④ Each query runs twice independently, so a report that cites its sources by luck once still
gets caught.
⑤ raise_for_status() turns a failed item into a raised EvalNotPassedError instead of a result
you have to remember to check.
Note: The full extracted listing at
code/microsoft_agent_framework/part-10-observability-and-evaluation/listings/03-cites-sources-evaluator.py
shows this evaluator with the keyword_check import and the agent it runs against.
Run that against a handful of research topics and you have a repeatable answer to a question a trace alone cannot give you: not just that the agent produced a report, but that the report it produced actually cites its sources, a ## Sources section with something in it, across every topic and every repetition, not just the one you happened to read closely.
Evaluating a workflow's output, not just a single agent turn
One more shape is worth knowing: evaluate_workflow runs the same evaluators against a multi-agent workflow's output, and it adds a per-agent breakdown the single-agent version does not have.
from agent_framework import evaluate_workflow

eval_results = await evaluate_workflow(
    workflow=workflow,
    queries=["Plan a trip to Paris"],
    evaluators=evals,
)
for r in eval_results:
    print(f"{r.provider}: {r.passed}/{r.total}")
    for name, sub in r.sub_results.items():
        print(f"  {name}: {sub.passed}/{sub.total}")
When a single agent gets split into a researcher, a fact-checker, and a writer wired into a workflow, this is the function that scores each of them individually as well as the workflow's combined output, so a failing overall score does not leave you guessing which agent actually caused it. Workflows also carry their own observability layer on top of the same GenAI conventions, spans like workflow.build, workflow.run, executor.process, and edge_group.process that trace message routing through the graph itself, not just the model calls inside it. The same instrumentation habit you build for one agent extends cleanly once there is a graph of them.
Do this today
- Call
configure_otel_providers()(Python) or wrap your chat client and agent withUseOpenTelemetry/WithOpenTelemetry(C#) before you build anything else. It is one line, and without it every span the harness emits has nowhere to go. - Run the Aspire Dashboard locally and confirm you can see
invoke_agent,chat, andexecute_toolspans nested correctly for a real run, before you assume tracing works in a deployed environment. - Leave
ENABLE_SENSITIVE_DATAoff everywhere except your own development box. Turn it on only when you need to read a prompt or response to debug a specific failure. - Write one custom
@evaluatorthat checks the one thing your agent's output must always do, a citation, a required section, a word limit, and run it withLocalEvaluatorbefore you ever reach for a cloud judge. - Run
evaluate_agentwithnum_repetitionsset to 3 or more on at least one query before you trust a passing result. A single pass tells you almost nothing about a nondeterministic system.
Proof, not a screenshot
Observability and evaluation answer two different questions, and you need both. Tracing tells you what an agent actually did: which spans fired, which tools ran, how long each model call took, all following the same GenAI semantic conventions whether you are pointed at the Aspire Dashboard on your laptop or Azure Monitor in production. Evaluation tells you whether what it did was good: a keyword check, a tool-call check, a custom function scored against any piece of the conversation, run once for a quick sanity check or across repetitions to catch the nondeterminism a single pass hides.
Wire both onto an agent and you stop needing to be in the room. The trace tells you what happened while you were away. The evaluator tells you whether it was still doing its job. That is the actual difference between a demo and a system you can trust unattended: not that it works once while you watch, but that it keeps working, provably, when you do not.